Hello again!
I’m back with the other use case I have in mind for Report-layer scripts. If you haven’t read yet my previous blog post I recommend you do this now as we’ll be building on that with a more complex use case. When I first managed to develop C# in visual studio I rushed to write something I could not build by adapting code snippets only. I made a script that iterated the model relationships and built measures to detect invalid relationships. Not only that, if you build the proper table with the column of the «many» side of the relationship with the measure, you can identify who are the offending values and take action. The script is cool as it is, but again, building each of the tables is quite a pain. Let’s see if we can automate this one. This time I’ll be writing as I author the script. Let’s see how it goes.
The model
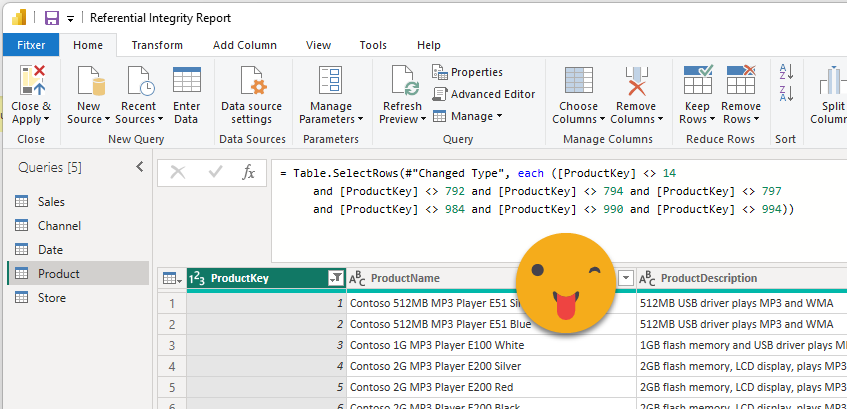
Well, we’ll need a model with some referential integrity violations. I loaded a good old contoso model, but I removed some keys from each of the dimensions to have something to show. If your project contains any manually-maintained dimension, don’t worry this will happen, naturally. Some people may be thinking — «wait, why build something so complex if vertipaq analyzer already tells you of any invalid relationship and even shows some examples?». Well it’s true, but that’s a tool you’ll use during development only. Or will you connect to the model AFTER EVERY REFRESH to check everything is alright? I haven’t checked but you may be able to build something with the new INFO.* functions. However, there’s a few «buts». First I’m not totally sure it’s already implemented, second you will not get the complete list of offending values, third it’s tricky to add to your report as you cannot use INFO functions in either measures or calculated tables at this point and you need to use some workarounds. Ok, with this out of the way, let’s continue. I went into Power Query to get rid of some keys on the dimension tables to ensure we’ll have some RI violations.
The desired report page
Once I had a model with report violations, I created the simplest calc table called «Referential Integrity» just to store the measures generated by the script introduced in the blog post I mentioned above. Once this was done I started building the report page I’d like to see automatically by the end of this article. It’s a report page where all measures have been generated by a macro so there’s no need to ask the user anything. At least on that front.
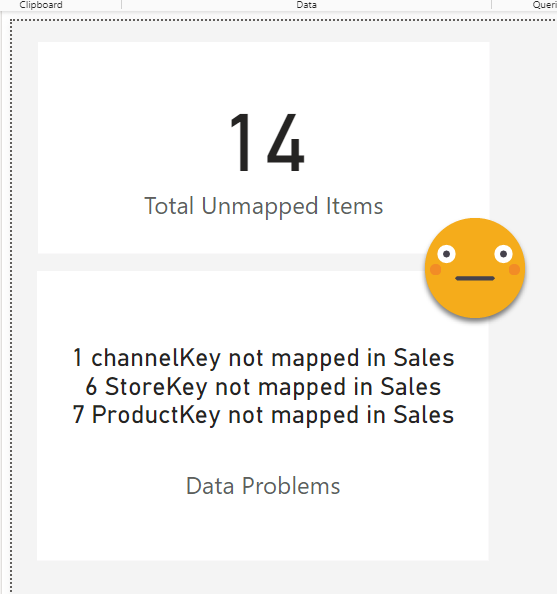
As a recap from the first article, once you have the measures created, the first thing you may want to do is to add a couple of KPI cards on your report page. One with the «Total data problem» which just shows the number of non-mapped items (i.e. number of different values in fact tables missing a counterpart on the dimension table). On a perfect model this card should be blank. When it’s not you need to know why. So you can add another KPI card with the measure «Data problems». This measure will summarize everything that is wrong in your model, from a referential integrity perspective. The two cards may look like this:
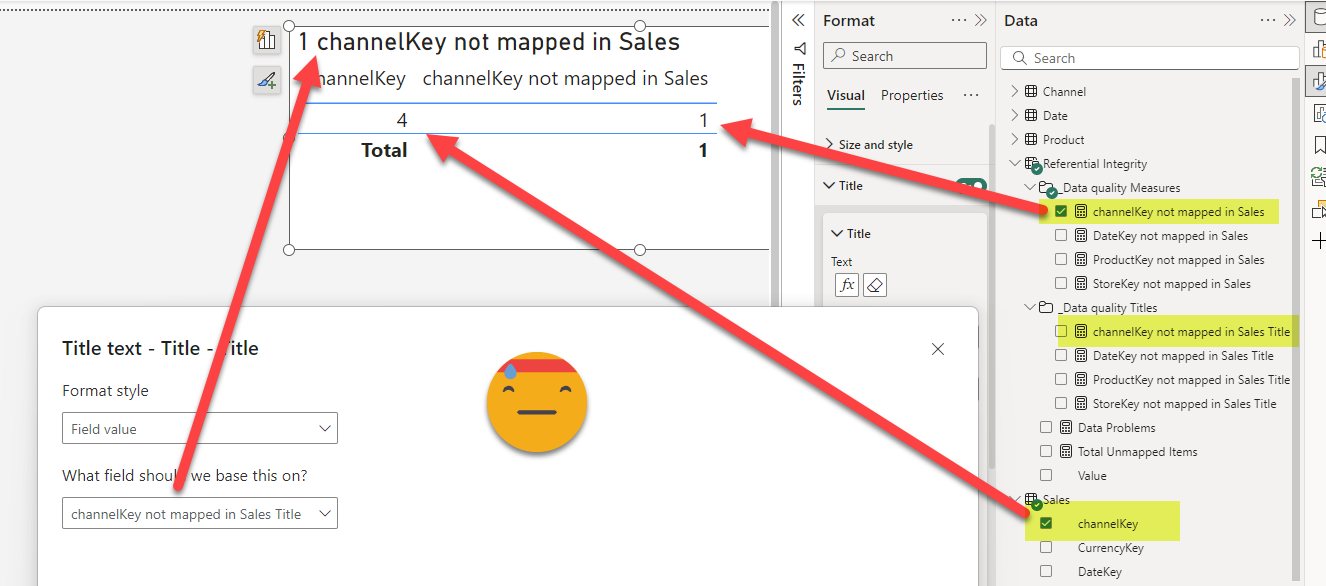
Of course the next question is «What are these values that are not mapped?» For this, you can build a table for each relationship like this:
It’s straight forward, but for large models is time consuming and boring.
- Add table visual
- Drag in the key column from the Fact table (the many side of the relationship)
- Drag in the measure from the «_Data quality Measures» display folder
- Configure dynamic title and choose the measure from the «_Data Quality Titles»
When you do it manually you only do it for those relationships that have a referential integrity violation. But indeed any relationship could have a referential integrity violation after each refresh. You can either trust your ETL process –which may be the right choice in many scenarios– or you can check. This is definitely the way to go if there’s any excel as data source for either the fact or the dimension tables. We’re just creating measures, so the model size will not change. The measures should not be too time consuming either, and remember they will only be evaluated if they are in the report that you are seeing.
So we will want a table like this for each of the measures we have in the «_Data quality Measures» display folder. But we’ll leave that to the script. For now we should have already all the examples we need to build our script.
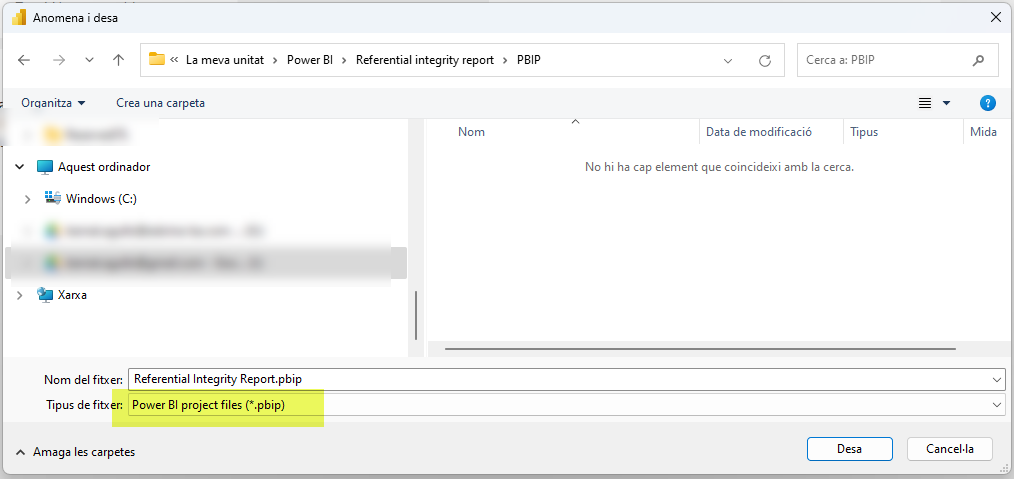
Save as PBIP format with PBIR preview feature enabled
In order to have everything in beautiful and small text files, we need to make it happen. Head over to configuration –> preview features and enable these two checkboxes (you are checking PBIR you may as well check that on TMDL for the sake of testing everything) 
When you enable them you may have to restart Power BI desktop, and then you’ll be able to save your pbix file into this new PBIP folder structure which will include the new PBIR format for the report layer
And indeed now we see plenty of little files:
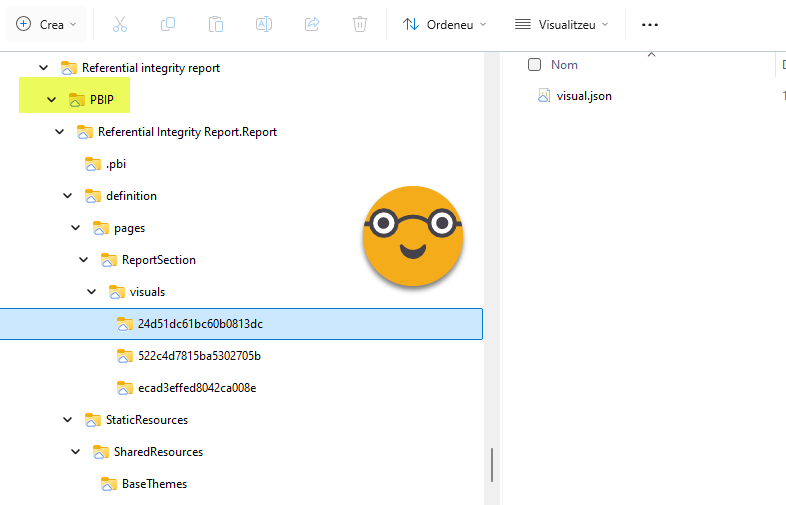
Surprisingly the id of the page is just «ReportSection» normally they have much more random ids, just like those of the visuals. Since so far we only have three visual objects, we get only 3 folders, each with a different id.
Let’s do this!
From this point on, we’ll follow the 11 steps outlined in my previous blog post where the point was to show that you can indeed modify the report layer with a c# script.
Step 1: Identify the measures in the old script
Here we’ll have a variable number of measures so we need to get a bit more sophisticated
First some identifiers and an index:
string annLabel = "ReferencialIntegrityMeasures";
string annValueTotal = "TotalUnmappedItems";
string annValueDetail = "DataProblems";
string annValueDataQualityMeasures = "DataQualityMeasure";
string annValueDataQualityTitles = "DataQualityTitle";
int measureIndex = 0;
Now whenever the relationship fulfills the conditions to create the measure, it’s time to increment the index and add the annotations:
foreach (var r in Model.Relationships)
{
    ...
    if (isOneToManyOrManyToOne)
    {
        measureIndex++; //increment index

        Measure newCounter = tableToStoreMeasures.AddMeasure(...);
        ...
        newCounter.SetAnnotation(annLabel, annValueDataQualityMeasures + "_" + measureIndex.ToString());
        ...
        Measure newTitle = tableToStoreMeasures.AddMeasure(...);
        ...
        newTitle.SetAnnotation(annLabel, annvalueDataQualityTitles + "_" + measureIndex.ToString());
    };

};
Of course for the general total and detail measures:
Measure counter = tableToStoreMeasures.AddMeasure(...);
...
counter.SetAnnotation(annLabel, annValueTotal);

Measure descr = tableToStoreMeasures.AddMeasure(...);
...
descr.SetAnnotation(annLabel, annValueDetail);
Step 2: At the beginning of the new script, make sure that all enough measures exist!
Since we have a variable number of measure here too we’ll have to get fancier.
string[] annotationArray = new string[4] { annValueTotal, annValueDetail, annValueDataQualityMeasures, annvalueDataQualityTitles };

foreach (string annotation in annotationArray)
{
    if (!Model.AllMeasures.Any(m =﹥ m.GetAnnotation(annLabel).StartsWith(annotation)))
    {
        Error(String.Format("No measure found with annotation {0} starting with {1} ", annLabel, annotation));
        return;
    }

}
You see we changed the exact equality with a StartsWith to account of the possible index values that may come with the last two annotation values. Also changed a bit the error message.
Step 3: Make the user point out to the PBIR file
here no change at all, so no need to comment any aspect.
Step 4: Create a couple of unique identifiers
Well, no change on the actual code, but of course we’ll have to include the id for the visual in the loop that will create each of the different tables
Step 5: Get references to each of the measures
How can we handle a variable number of measures? Well, here’s when collections come in handy:
Measure totalMeasure =
    Model.AllMeasures
        .Where(m =﹥ m.GetAnnotation(annLabel) == annValueTotal)
        .FirstOrDefault();

Measure detailMeasure =
    Model.AllMeasures
        .Where(m =﹥ m.GetAnnotation(annLabel) == annValueDetail)
        .FirstOrDefault();

IEnumerable﹤Measure﹥ dataQualityMeasures =
    Model.AllMeasures
        .Where(m =﹥; m.GetAnnotation(annLabel)
        .StartsWith(annValueDetail));

IEnumerable﹤Measure﹥ dataQualityTitles =
    Model.AllMeasures
        .Where(m =﹥ m.GetAnnotation(annLabel)
        .StartsWith(annvalueDataQualityTitles));
Hey but how did I know I had to write this IEnumberable<Measure> thing in the first place? Well, for these things is when authoring code in Visual Studio becomes so easy…

Ok, to be honest, I just checked and you also get some of that in TE3 C# tab, but it’s much smaller, it tends to disappear quickly and you can’t navigate to other «overloads» (different possibilities to provide the parameters on the same function).
Anyway, now we have two measures and two collections of measures!
Step 6: Define the template for the page and the visuals
Everything regarding the page itself will be the same as in the previous article, so no need to discuss. Well, ok, I added the background color and transparency (by default it’s 100% so you need to set it to 0)
Also since we are using two KPI cards, we could use the same template. I chose to reduce the font on the card with the detail, so we’ll need a placeholder for that. But wait. I went in to compare the two visuals for the two KPI cards, and the one of the total, since I did not configure the font size, there’s no definition for it. Smart. Otherwise JSON files would not be that small…
Now that I look at even more detail I see that the total items card has a «sort» property that the other one does not have?? Ok, I think I’ll create two different templates to stay out of trouble.
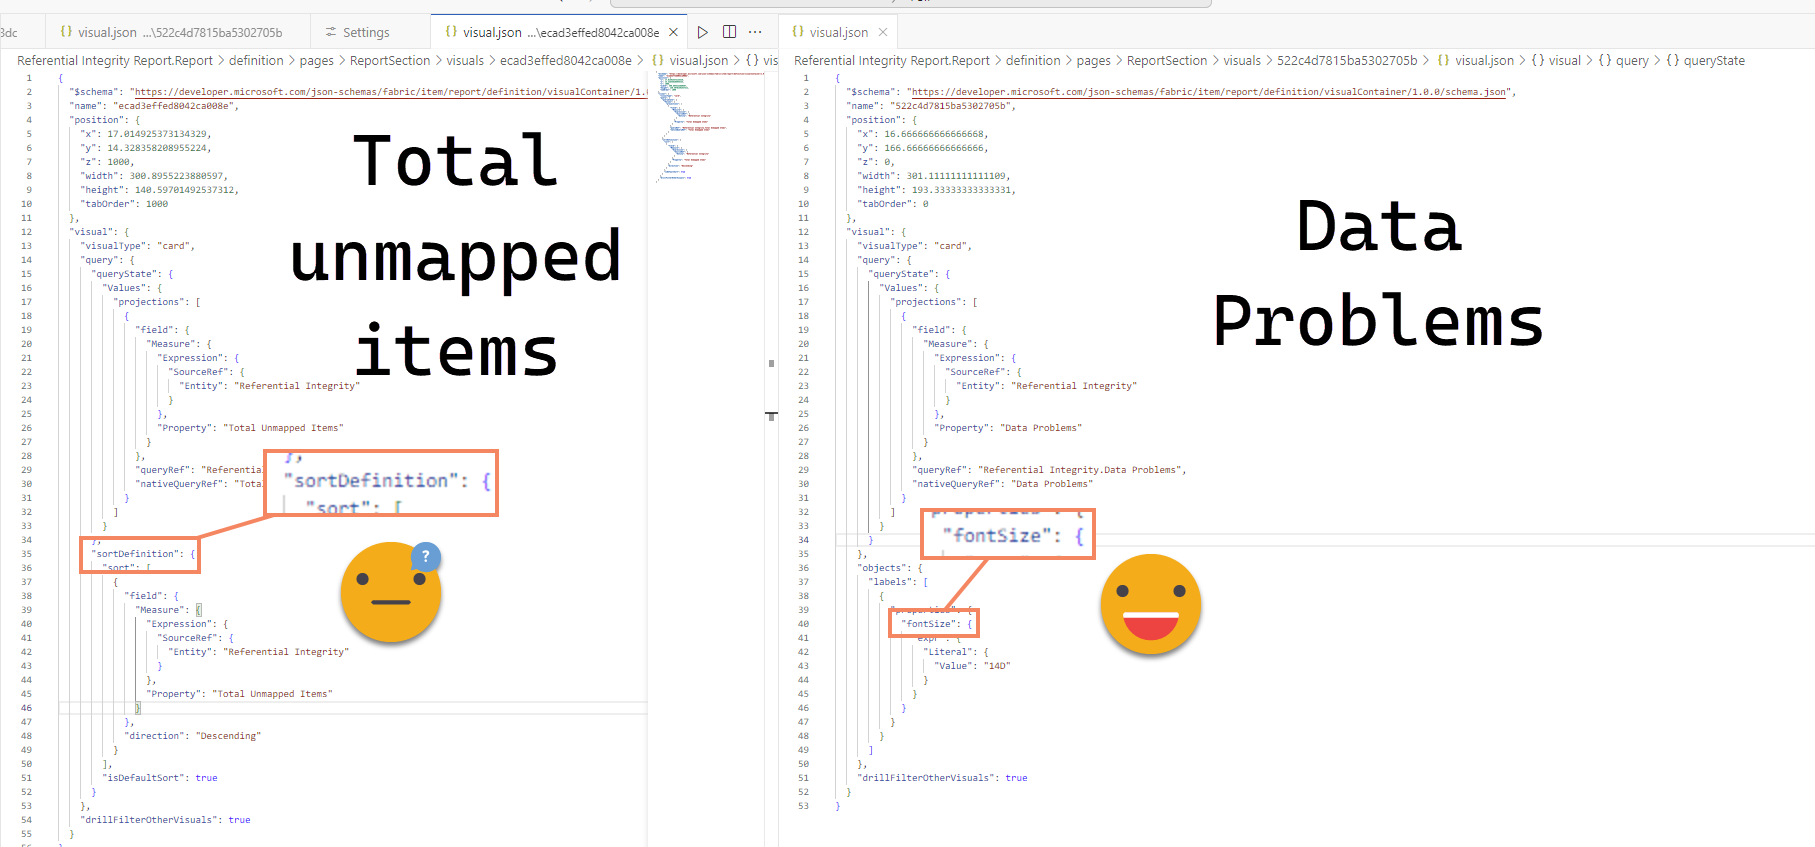
I also see that it assigns tab order values in steps of 1000. Well, it reminds me assigning Calc Group precedence values in steps of 10. Just in case!
So anyway, as I started playing with it I thought it would be nice to parametrize the main properties as well, so for the total card it looks something like this:
{
  ""$schema"": ""https://developer.microsoft.com/json-schemas/fabric/item/report/definition/visualContainer/1.0.0/schema.json"",
  ""name"": ""{{newVisualId}}"",
  ""position"": {
    ""x"": {{totalCardX}},
    ""y"": {{totalCardY}},
    ""z"": {{zTabOrder}},
    ""width"": {{totalCardWidth}},
    ""height"": {{totalCardHeight}},
    ""tabOrder"": {{zTabOrder}}
  },
  ""visual"": {...}
}
As you can see newVisualId and zTabOrder do not have the «totalCard» prefix. These will be assigned as we create them for real. We’ll be using them as well in the table visuals. Here the main takeaway is that no matter how long the json is, wherever you see the measure name add a {{measureXname}} placeholder, and if you see the name of the table where it is, then use {{measureXtable}}. Then other property you recognize, choose if you want to parametrize it or not. Anything else –> *don’t touch it*.
Oops
Ok, now that I have a look at the table visual, I see that we need to specify the fact table name and the fact table column we are using… duh! But of course this is not easy by just having the measure. Oh well, we’ll need to modify the original script to add an annotation to the corresponding fact table column with the same index. We could do the same on the dimension side, but didn’t find a need for it.
this bit needs to be added on the old script
string annValueFactColumn = "FactColumn";
...
manyColumn.SetAnnotation(annLabel, annValueFactColumn + "_" + measureIndex.ToString());
While I was there in the old script I added some code to create an extra collection of measures for the subtitles, saying in which table the values are missing to make the visual extra clear on what it means. Now that the machine will be working, let’s get fancy!
//add measure for subtitle saying how many need to be added to the dimension table
string orphanTableSubtitleMeasureExpression =
    String.Format(
        @"FORMAT({0}+0,""{1}"") & "" values missing in "" & ""{2}""",
        newCounter.DaxObjectFullName,
        newCounter.FormatString,
        oneColumn.Table.Name);
string orphanTableSubitleMeasureName = newCounter.Name + " Subtitle";
Measure newSubtitle = tableToStoreMeasures.AddMeasure(name: orphanTableSubitleMeasureName, expression: orphanTableSubtitleMeasureExpression, displayFolder: "_Data quality Subtitles");
newSubtitle.FormatDax();
newSubtitle.SetAnnotation(annLabel, annValueDataQualitySubtitles + "_" + measureIndex.ToString());
This String.Format is very convenient to create complex strings, it replaces each placeholder with whatever you put in the followin arguments, in order.
Now back to the new script we could add a check that there are columns with the requited annotation, but if it passes the test with the measures, let’s assume all is well.
What we need is this bit, that should be added to what we did on step 5
IEnumerable﹤Measure﹥ dataQualitySubtitles =
    Model.AllMeasures
        .Where(m =﹥ m.GetAnnotation(annLabel)
        .StartsWith(annValueDataQualitySubtitles));

IEnumerable﹤Column﹥ factTableColumns =
    Model.AllColumns
        .Where(c =﹥ c.GetAnnotation(annLabel)
        .StartsWith(annValueFactColumn));
Ok with this elements we can finally complete the visual templates.
Step 7: Build the dictionary to replace placeholders
This time this proved a bit more tricky as some entries of the dictionary could stay the same but others needed to be updated for each iteration. And the iteration itself was tricky too.I had 4 collections, three collections of measures (data quality, title and subtitle) and one of columns (fact table columns). But I needed to iterate them all at once. You cannot navigate collections with an index, so here I had the first trouble. After some looking around, I decided to convert the collections into lists, which can indeed be accessed with an index. I also added a sortby clause to the lambda expression to make sure I got the same item from each collection. Finally I also saw that this StartsWith condition produces an error when the annotation is null, which will be for most objects (i.e. if you check an annotation with certain name in an object that does not have it, you get a null). So I had to add a condition for the annotation not to be null. Oh well, I’ll just copy one of them, but they look like this in the final version:
IList﹤Measure﹥ dataQualityMeasures =
    Model.AllMeasures
        .Where(m =﹥ m.GetAnnotation(annLabel) != null
            🙴🙴 m.GetAnnotation(annLabel).StartsWith(annValueDataQualityMeasures))
        .OrderBy(m =﹥ m.GetAnnotation(annLabel))
        .ToList﹤Measure﹥();
The nice thing now is that even though we have placeholders for each property, we can play with the variables to define their values. I decided to set up a height for the total card, and a minimum size for the detail card. Tables have also a fixed height and width and a certain number per row. I used this information to calculate the width of the page, and checked the height of all tables and compared with the height of the two cards. Whichever is larger defines the height of the page. Once this height is fixed I adjust the height of the detail card to make sure expands all the way to the bottom of the page.
string pageName = "Referential Integrity";
int interObjectGap = 15;
int totalCardX = interObjectGap;
int totalCardY = interObjectGap;
int totalCardWidth = 300;
int totalCardHeight = 150;
int detailCardFontSize = 14;
int detailCardX = interObjectGap;
int detailCardY = totalCardY + totalCardHeight + interObjectGap;
int detailCardWidth = 300;
int detailCardHeight = 200; //this works as minimum height
int tablesPerRow = 3;
int tableHeight = 250;
int tableWidth = 300;
int backgroundTransparency = 0;
string backgroundColor = "#F0ECEC";
//retrieves the measures and columns from the model
...
//now that we now number of tables we'll need, let's set up the page size.
int tableCount = dataQualityMeasures.Count();
decimal rowsRaw = (decimal) tableCount / (decimal) tablesPerRow;
int rowsOfTables = (int)Math.Ceiling(rowsRaw);
int pageWidth = totalCardX + totalCardWidth + interObjectGap + (tableWidth + interObjectGap) * tablesPerRow ;
int totalTablesHeight = interObjectGap + (tableHeight + interObjectGap) * rowsOfTables;
int totalCardsHeight = detailCardY + detailCardHeight + interObjectGap;
int pageHeight = Math.Max(totalTablesHeight,totalCardsHeight);

//adjust detail card height to fill the height if tables are taller
detailCardHeight = pageHeight - 3 * interObjectGap - totalCardHeight;
Here the rowsOfTables calculation was a major gotcha. For some reason it was calculating a single row and I could not understand why. I was doing a Math.Ceiling! this should round the number up! Well, welcome to C# where the division of a two integers is also an integer! even if you then store it as decimal. That’s why you first need to convert to decimal the numerator and denominator (just in case).
Of course all this becomes more tricky when you make typos, and mistakes in general…
I decided to create the dictionary for all placeholders and then for each iteration I will update those that need to be updated:
Dictionary﹤string, string﹥ placeholders = new Dictionary﹤string, string﹥();
placeholders.Add("{{newPageId}}", "");
placeholders.Add("{{newVisualId}}", "");
placeholders.Add("{{pageName}}", pageName);
placeholders.Add("{{totalMeasureTable}}", totalMeasure.Table.Name);
placeholders.Add("{{totalMeasureName}}", totalMeasure.Name);
placeholders.Add("{{dataProblemsMeasureTable}}", detailMeasure.Table.Name);
placeholders.Add("{{dataProblemsMeasureName}}", detailMeasure.Name);
placeholders.Add("{{factTableName}}", "");  //factColumn.Table.Name);
placeholders.Add("{{factColumnName}}", "");  // factColumn.Name);
placeholders.Add("{{dataQualityMeasureTable}}", "");  // dataQualityMeasure.Table.Name);
placeholders.Add("{{dataQualityMeasureName}}", "");  //dataQualityMeasure.Name);
placeholders.Add("{{dataQualityTitleMeasureTable}}", "");  // dataQualityTitleMeasure.Table.Name);
placeholders.Add("{{dataQualityTitleMeasureName}}", "");  //dataQualityTitleMeasure.Name);
placeholders.Add("{{dataQualitySubtitleMeasureTable}}", "");  //dataQualitySubtitleMeasure.Table.Name);
placeholders.Add("{{dataQualitySubtitleMeasureName}}", "");  //dataQualitySubtitleMeasure.Name);
placeholders.Add("{{pageHeight}}", pageHeight.ToString());
placeholders.Add("{{pageWidth}}", pageWidth.ToString());
placeholders.Add("{{detailCardX}}", detailCardX.ToString());
placeholders.Add("{{detailCardY}}", detailCardY.ToString());
placeholders.Add("{{detailCardWidth}}", detailCardWidth.ToString());
placeholders.Add("{{detailCardHeight}}", detailCardHeight.ToString());
placeholders.Add("{{detailCardFontSize}}", detailCardFontSize.ToString());
placeholders.Add("{{totalCardX}}", totalCardX.ToString());
placeholders.Add("{{totalCardY}}", totalCardY.ToString());
placeholders.Add("{{totalCardWidth}}", totalCardWidth.ToString());
placeholders.Add("{{totalCardHeight}}", totalCardHeight.ToString());
placeholders.Add("{{zTabOrder}}", 0.ToString());
placeholders.Add("{{tableX}}", 0.ToString());
placeholders.Add("{{tableY}}", 0.ToString());
placeholders.Add("{{tableWidth}}", tableWidth.ToString());
placeholders.Add("{{tableHeight}}", tableHeight.ToString());
placeholders.Add("{{backgroundColor}}", backgroundColor);
placeholders.Add("{{backgroundTransparency}}", backgroundTransparency.ToString());
You might think, «Bernat, storing integers as string is just wrong, why are you doing that?» Well, as a matter of fact I did have a separate dictionary for those. Until I realized I needed the values to replace the placeholders in a STRING variable… So strings it is.
Once this initial dictionary is set up is time to start configuring the final touches like creating an Id and so on and start generating the page, and each of the visuals. I’ll copy here the code and comment the key points underneath.
string pagesFolder = Fx.GetPagesFolder(pbirFilePath);
string newVisualId = "";
string tableContents = "";
int zTabOrder = -1000;
//create new page
string newPageId = Guid.NewGuid().ToString();
placeholders["{{newPageId}}"] = newPageId;
zTabOrder = zTabOrder + 1000;
placeholders["{{zTabOrder}}"] = zTabOrder.ToString();
string pageContents = Fx.ReplacePlaceholders(pageContentsTemplate,placeholders);
string newPageFolder = Fx.AddNewPage(pageContents, pagesFolder, newPageId);
//create total card
newVisualId = Guid.NewGuid().ToString();
placeholders["{{newVisualId}}"] = newVisualId;
zTabOrder = zTabOrder + 1000;
placeholders["{{zTabOrder}}"] = zTabOrder.ToString();
string totalCardContents = Fx.ReplacePlaceholders(totalCardContentsTemplate,placeholders);
Fx.AddNewVisual(visualContents: totalCardContents, pageFolder: newPageFolder, newVisualId: newVisualId);
//create detail card
newVisualId = Guid.NewGuid().ToString();
placeholders["{{newVisualId}}"] = newVisualId;
zTabOrder = zTabOrder + 1000;
placeholders["{{zTabOrder}}"] = zTabOrder.ToString();
string detailCardContents = Fx.ReplacePlaceholders(detailCardContentsTemplate, placeholders);
Fx.AddNewVisual(visualContents: detailCardContents, pageFolder: newPageFolder, newVisualId: newVisualId);
int currentRow = 1;
int currentColumn = 1;
int startX = totalCardX + totalCardWidth + interObjectGap;
int startY = interObjectGap;
for(int i = 0; i ﹤ dataQualityMeasures.Count(); i++)
{
//get references and calculate values
Column factColumn = factTableColumns[i];
Measure dataQualityMeasure = dataQualityMeasures[i];
Measure dataQualityTitleMeasure = dataQualityTitles[i];
Measure dataQualitySubtitleMeasure = dataQualitySubtitles[i];
zTabOrder = zTabOrder + 1000;
newVisualId = Guid.NewGuid().ToString();
int tableX = startX + (currentColumn - 1) * (tableWidth + interObjectGap) ;
int tableY = startY + (currentRow - 1) * (tableHeight + interObjectGap) ;
//update the dictionary
placeholders["{{newVisualId}}"] = newVisualId;
placeholders["{{zTabOrder}}"] = zTabOrder.ToString();
placeholders["{{factTableName}}"] =factColumn.Table.Name;
placeholders["{{factColumnName}}"] = factColumn.Name;
placeholders["{{dataQualityMeasureTable}}"] = dataQualityMeasure.Table.Name;
placeholders["{{dataQualityMeasureName}}"] =dataQualityMeasure.Name;
placeholders["{{dataQualityTitleMeasureTable}}"] = dataQualityTitleMeasure.Table.Name;
placeholders["{{dataQualityTitleMeasureName}}"] =dataQualityTitleMeasure.Name;
placeholders["{{dataQualitySubtitleMeasureTable}}"] =dataQualitySubtitleMeasure.Table.Name;
placeholders["{{dataQualitySubtitleMeasureName}}"] =dataQualitySubtitleMeasure.Name;
placeholders["{{tableX}}"] = tableX.ToString();
placeholders["{{tableY}}"] = tableY.ToString();
//fill the template
tableContents = Fx.ReplacePlaceholders(tableContentsTemplate, placeholders);
//create the folder &amp;amp;amp;amp;amp; Json file
Fx.AddNewVisual(visualContents: tableContents, pageFolder: newPageFolder, newVisualId: newVisualId);
//update variables for the next table
currentColumn = currentColumn + 1;
if (currentColumn &amp;amp;amp;amp;gt; tablesPerRow)
{
currentRow = currentRow + 1;
currentColumn = 1;
}
}
We’ll talk about the Fx methods in the next steps, here the point is to see how we update some of variables like zTabOrder (I use it for both properties), or how we get a new id for each visual and then update the dictionary. As for the table X and Y we first calculate the top left corner of the first table and from there we add the offset using the number of column and number of row. Not rocket science, but is nice to be able to apply this to a Power BI Report. Finally!
Step 8: A function to replace all placeholders
The method is exactly the same as in my previous article but I moved it to my general functions class, as I figure out how to streamline my report-layer script authoring experience. If I was a proper C# programmer I would have everything tidy in separate project files and so on, but putting it all together to build the actual script is just too much pain.
Step 9: Creating the files & folders for page and visuals + Step 10: Modifying the pages.json file + Step 11: A little bit of house-keeping
In the first article I combined it all in one method, but here it became obvious that I needed to split the two things. For this reason too, I spin of other functions like getting the pagesFolder from the pbir filePath. These are the methods inside the custom Fx Class:
public static string GetPagesFolder(string pbirFilePath)
{
    FileInfo pbirFileInfo = new FileInfo(pbirFilePath);
    string pbirFolder = pbirFileInfo.Directory.FullName;
    string pagesFolder = Path.Combine(pbirFolder, "definition", "pages");
    return pagesFolder;
}
public static string AddNewPage(string pageContents, string pagesFolder, string newPageId)
{

    string newPageFolder = Path.Combine(pagesFolder, newPageId);

    Directory.CreateDirectory(newPageFolder);

    string newPageFilePath = Path.Combine(newPageFolder, "page.json");
    File.WriteAllText(newPageFilePath, pageContents);

    string pagesFilePath = Path.Combine(pagesFolder, "pages.json");
    AddPageIdToPages(pagesFilePath, newPageId);

    return newPageFolder;
}
public static void AddNewVisual(string visualContents, string pageFolder, string newVisualId)
{
    string visualsFolder = Path.Combine(pageFolder, "visuals");

    //maybe created earlier
    if (!Directory.Exists(visualsFolder))
    {
        Directory.CreateDirectory(visualsFolder);
    }

    string newVisualFolder = Path.Combine(visualsFolder, newVisualId);

    Directory.CreateDirectory(newVisualFolder);

    string newVisualFilePath = Path.Combine(newVisualFolder, "visual.json");
    File.WriteAllText(newVisualFilePath, visualContents);

}
private static void AddPageIdToPages(string pagesFilePath, string pageId)
{
    string pagesFileContents = File.ReadAllText(pagesFilePath);
    PagesDto pagesDto = JsonConvert.DeserializeObject﹤PagesDto﹥(pagesFileContents);
    if(pagesDto.pageOrder == null)
    {
        pagesDto.pageOrder = new List﹤string﹥();
    }

    if (!pagesDto.pageOrder.Contains(pageId)) {

        pagesDto.pageOrder.Add(pageId);
        string resultFile = JsonConvert.SerializeObject(pagesDto, Formatting.Indented);
        File.WriteAllText(pagesFilePath, resultFile);
    }
}
And after the Fx Class, we need the same class we used in the previous post to parse the pages.json file:
public class PagesDto
{
    [JsonProperty("$schema")]
    public string schema { get; set; }
    public List﹤string﹥ pageOrder { get; set; }
    public string activePageName { get; set; }
}
Here the only things worth mentioning is the fact that AddNewPage now returns the path of the new page, and that when you create a Visual you will need to create first a Visuals folder, but only the first time!
All these took a LOT of trial and error, believe me. Maybe coding for hours and hours straight was not the smartest move.
The result!
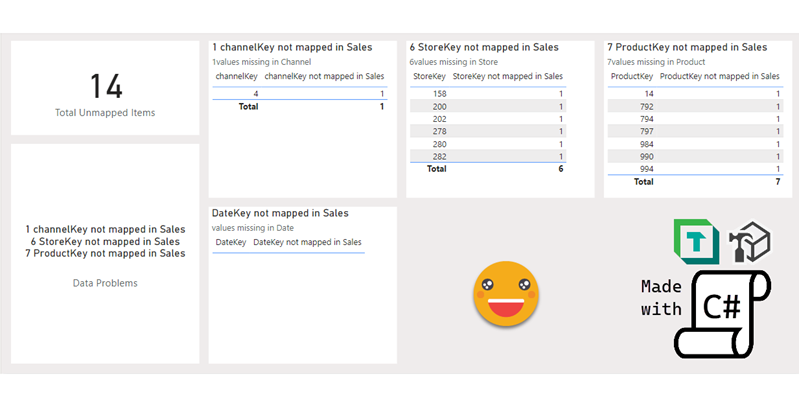
Well the final result is quite nice if you ask me. And it should look nice wether you have 4 dimensions or 14. Of course you will probably never have RI violations in most of them, but if you ever do the table will be already there to help you ideintify the culprits.
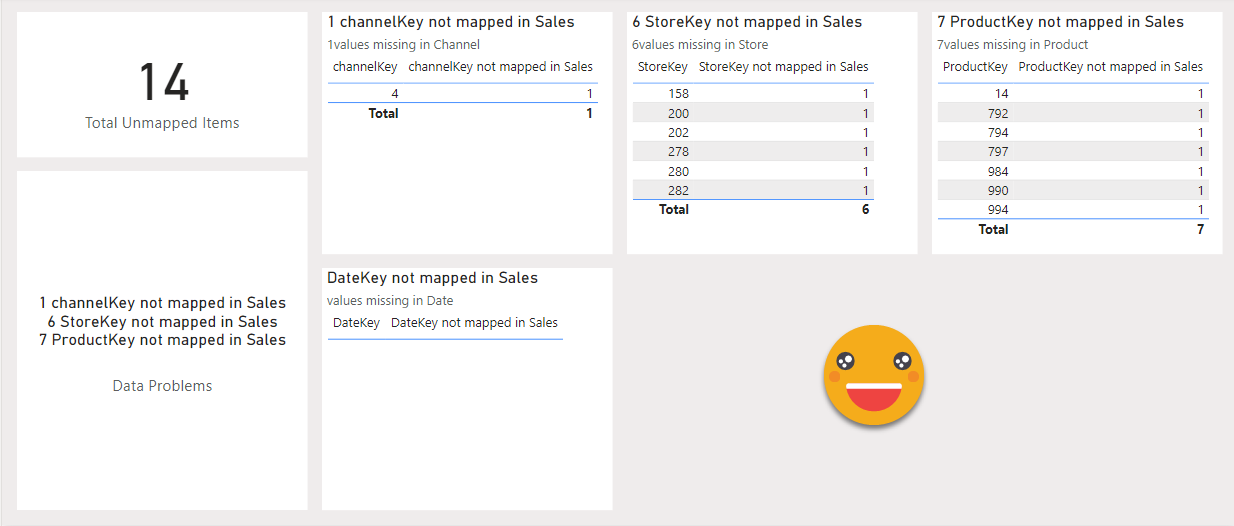
If you reached this point you are probably thinking «give me the script already!»and yes, I hear you.
- Referential Integrity Measures Script <– If you already have it, update the script!
- Referential Integrity Page Script
Execute them in this order! The measures script will now create the table to store the measures too if you execute from the model object.
Thanks for reading! Follow the conversation on twitter or LinkedIn
