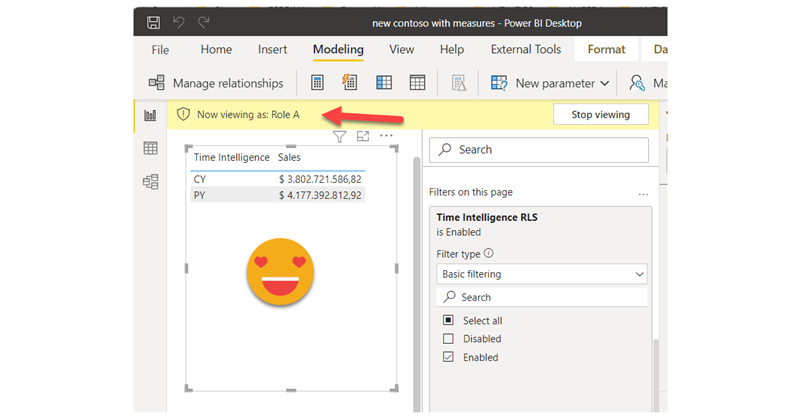
I thought I would let the blog rest for a few days, but I figured out I would write a short one on a topic that Rick brouhgt up on LinkedIn: Controlling Calculation Items with RLS. I lived under the impression that being a table you could just apply RLS like in any other table, but he told me that Power BI throws and error when you try, and sure enough I got the same result. Tried cheating by creating a calculated column in the Calculation group, but the same result. But then I remembered the technique I used on my article on arbitrary two row header tables, and I gave it a try. It does work, so if you’re interested, keep reading.
To test my theory first I needed some calc group with calculation items to control, so I opened my contoso dataset and build a time intelligence calc group with my script (grab it here if you don’t have it yet). The strategy here is to blank out whatever measure is in the scope depending on the selected role, and the selected calculation item from the time intelligence calculation group. I could hard code that in code, but thought it would be cleaner to have it all in a table. I built a quick dax table defining two roles and which calc items each role should see.

Now I needed to define the two security roles, filtering by Value1. No big deal.

And now we build the secondary calculation group that will –in practice– control the visibility of of the calc items of the Time Intelligence calc group. Jump into Tabular Editor, Add a new calculation group and build something like this.
---------------------------------------------
-- Calculation Group: 'Time Intelligence RLS'
---------------------------------------------
CALCULATIONGROUP 'Time Intelligence RLS'[Time Intelligence RLS]
    Precedence = 1

    CALCULATIONITEM "Disabled" =
        SELECTEDMEASURE ()

    CALCULATIONITEM "Enabled" =
        VAR timeIntelcalcItem =
            SELECTEDVALUE ( 'Time Intelligence'[Time Intelligence] )
        VAR validCalcItems =
            VALUES ( Roles[Value2] )
        RETURN
            IF ( timeIntelCalcItem IN validCalcItems, SELECTEDMEASURE () )
I even added a «disabled» calc item so you can see what it does.
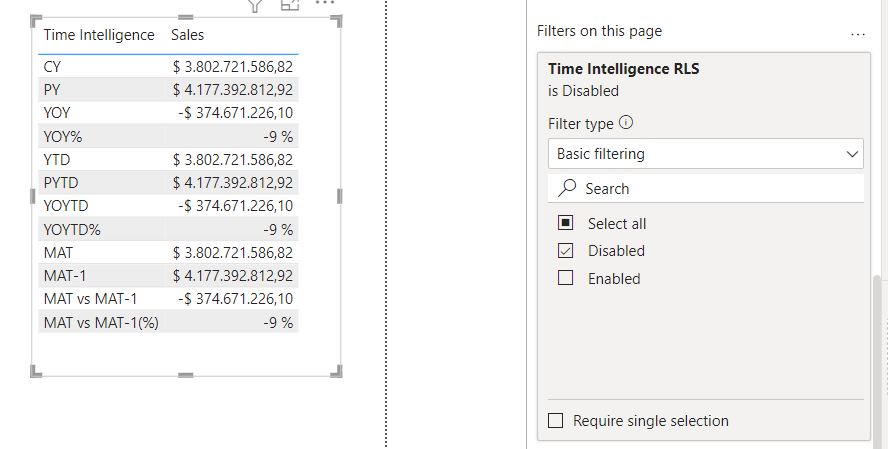
Now we build a Table with the Time Intelligence Calculation group column and any measure, like Sales. You can also apply the column of the new calculation group at the page level for example, and select the Disabled calc item, which will be the same as doing nothing. Filter by 2009 or so to get meaningful data and we see what we would always see, all the calc items.
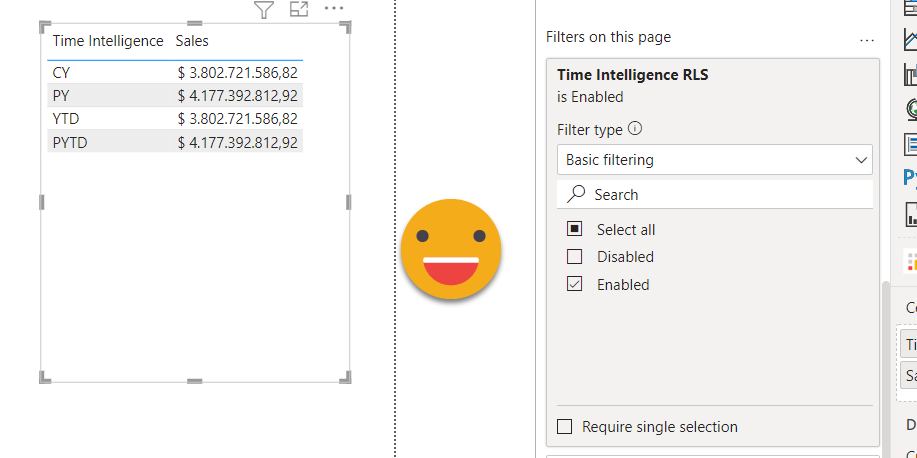
Now put the keys on the engine. If we turn on enabled, we’re still not using real RLS, but we now only see the calculation items that appear in the Roles table:
And from here is just one little step. Go to modeling and select Role A, then Role B, then Role A — until you are convinced that this works!
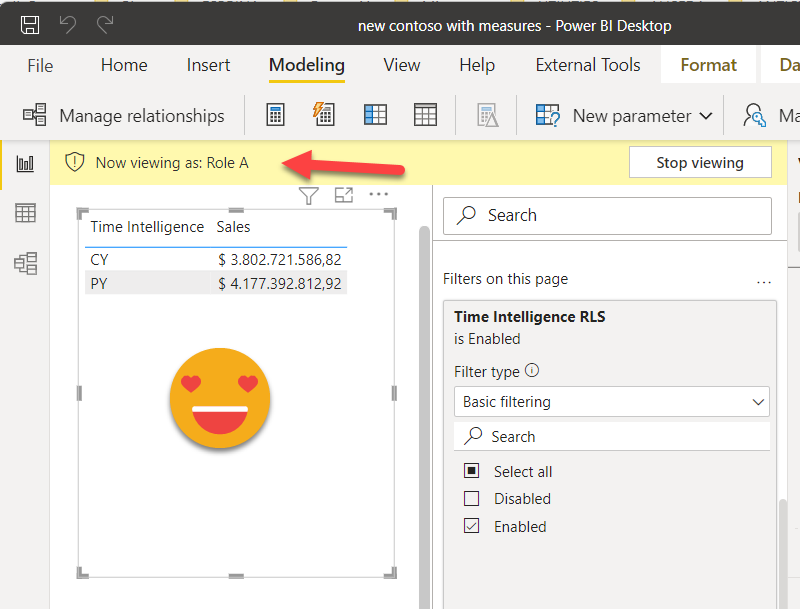
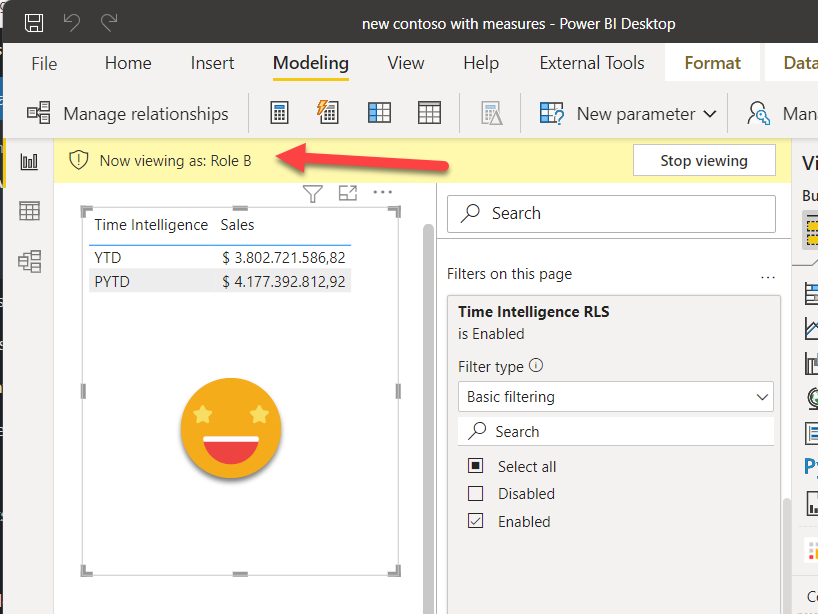
Ok, the numbers are the same, but that’s because we’re not filtering by any moth, ok 😁if you don’t trust me download the pbix and play with it yourself.
Now, is this real security?? Hmmm, nope. We’re not filtring the real data, just limiting somehow on the reporting layer which calculations are available. But with Analyze in Excel and other methodologies to get the data out, I really hope you have some alternative way to keep your data secure. Like real RLS on tables that filter your fact tables.
But if have a use case in which this sort of dynamic calc items can bring some value, now at least you have a way of implementing it. There are other possibilities as well, like putting all the logic in a single calc item and controlling which branch of the switch it evaluates through the values visible in an RLS filtered table. But if you don’t want to mess with your existing calc items, the approach here is quite clean and gets the job done.
I hope you liked it, and at least it was short this time, right?
Regards!
oh, the file, here it is.
******
PS: Receiving some feedback I thought it would be relevant to point a couple things out in case other people wonder about the same aspects of this implementation.
«It works well on a table, but what about a slicer?» It’s true that if you put it in a slicer you will see all calculation items, but actually the same happens on a table until you put a measure in it. So it’s the same approach, put a measure in the slicer visual level filter, and set it to «is not blank». This will leave only the acceptable calc items visible. It it’s one or more than one is your choice.
«Oh but I need a secondary calculation group?«. Well it you want to combine the logic in a single calc group of course you can. You just need to wrap all the logic you have already in the time intel calc group inside the expression we used for the Time Intelligence RLS. Remember, we are not really securing things in any real way, we’re just trying to hide some calculations, so if you want it to put it all together, go ahead. Remember to do something similar for the format string if you go down this path! You’ll still see all the calculation items in a slicer though, to hide them follow the instructions of the preceeding paragraph.
---------------------------------------------
-- Calculation Group: 'Time Intelligence RLS'
---------------------------------------------
CALCULATIONGROUP 'Time Intelligence'[Time Intelligence]
    CALCULATIONITEM "X" =
        VAR timeIntelcalcItem =
            SELECTEDVALUE ( 'Time Intelligence'[Time Intelligence] )
        VAR validCalcItems =
            VALUES ( Roles[Value2] )
        RETURN
            IF ( timeIntelCalcItem IN validCalcItems, --ORIGINAL CALC ITEM X EXPRESSION-- )
*********
PS2: When reading this article, many might be tempted to think that the approach shown by sqlbi to control measure visibility with OLS could work in this scenario. Sadly it does not. Since all calculation items are part of the same column, I guess it’s not possible to control each row of the table independently. I did try it, creating a couple of tables, then setting OLS to only be visible for one of the roles, and adding references in the calculation item code to the table that is visible to the role that should see the calc item. And this is what I got:
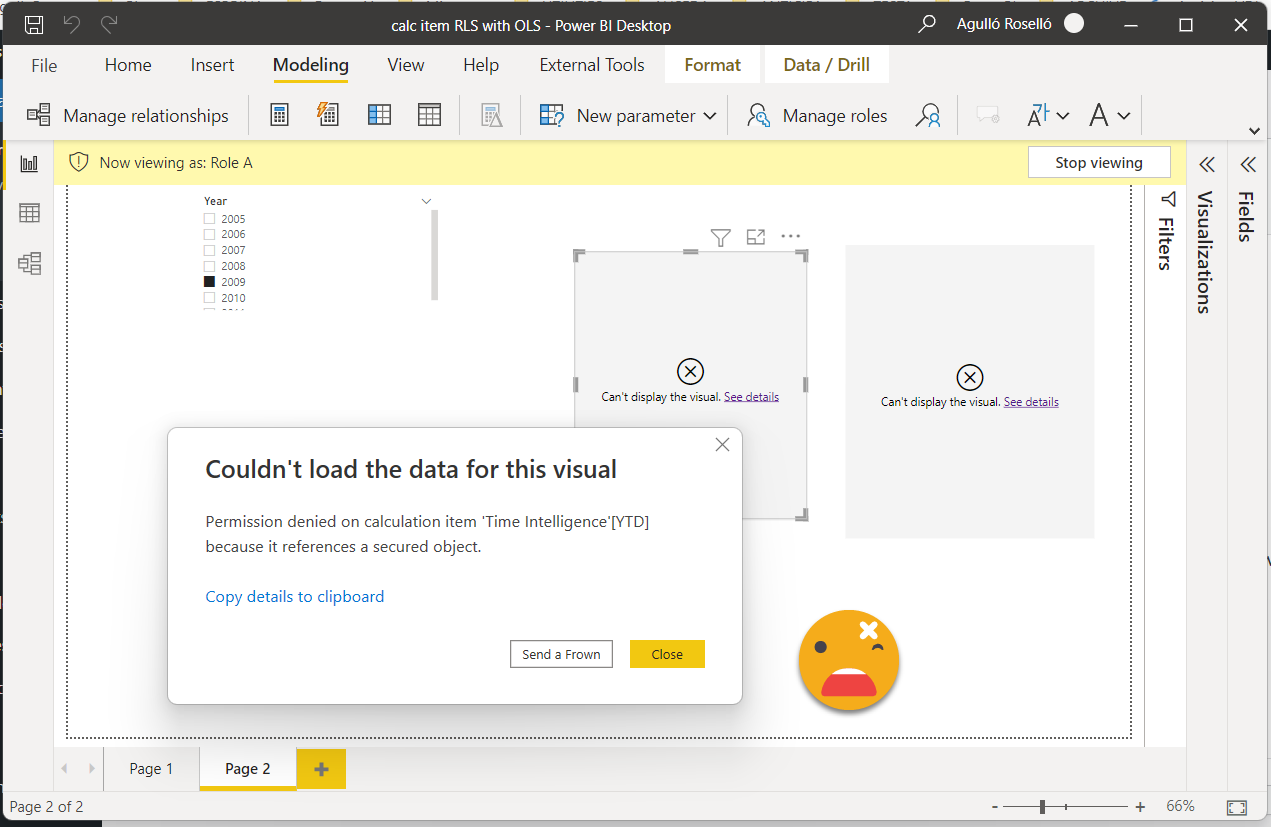
So this approach does not work.
****
