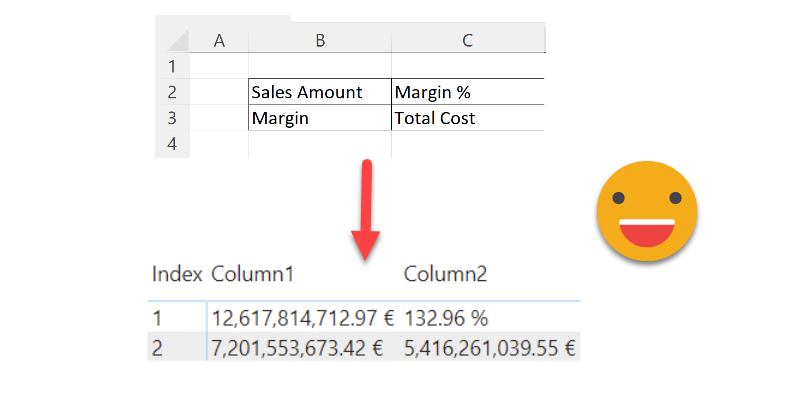
Hello there, this is not an entirely new technique, but then again, maybe the use case will be useful to someone, so I’ll go ahead and put it here. Indeed the idea came once again from the whatsapp group of Power BI User Group Barcelona, great people all around. Paul shared with the rest of us a solution he brought to a question in the Power BI Community Forum. I that thread (and answering the particular use case) a few solutions involved doing it all in Power Query, while Paul brought in a DAX approach to the solution. Beyond the particular use case of the question, this raises the question: how can we show individual measures in a tabular format? Continue Reading..
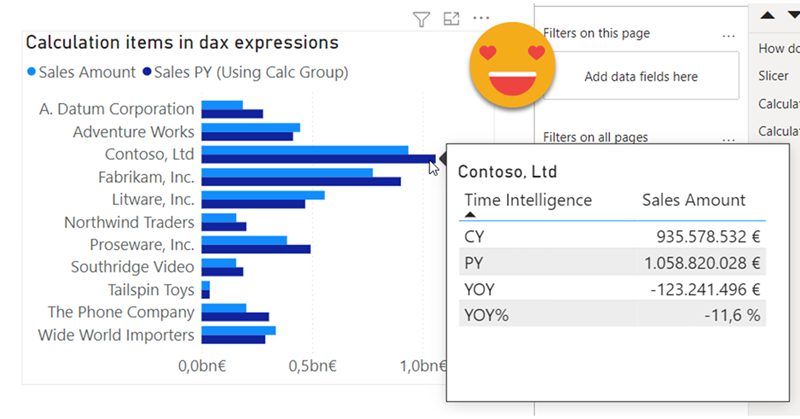
Hello there, quite a while ago I wrote a blog post explaining how to override calculation items in tooltip. Basically, if I’m using calc item A and B in a chart, how can I use A B C and D in the tooltip. My solution was to add 2 extra calculation groups with lower precedence, one to remove filters from the calculation group on the main visual, an the other one (copy of the original calculation group) to recreate the desired calculations. This solution does work, but is quite tedious to maintain if you have changes in the original calc group, and (I’m not sure if it’s related) when combined with the time intel dynamic label calc group, it took A LOT to display the tooltip. I tested again a few days ago and even with my new laptop (i7 32GB of ram) it took like 10s, most of them going to «other» things, not the dax query, so little can be done.
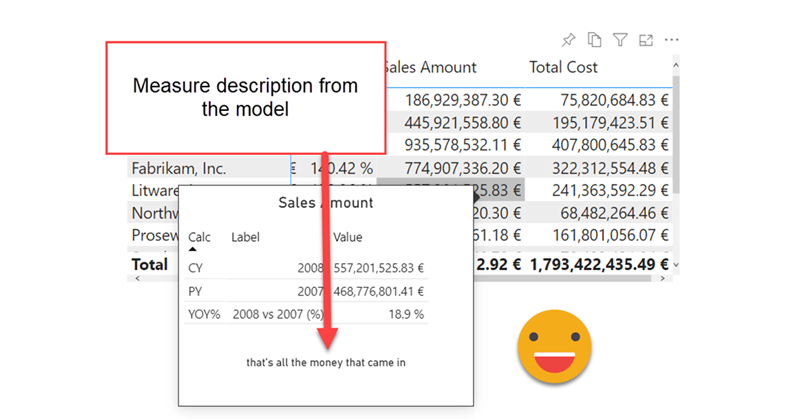
First of all I have to credit Dan Meissner for bringing up the use case in the SML forum. The idea is to add the measure description in the tooltip, somehow. He thought that calc groups might be part of the solution, as they are «aware» of the measures in the filter context and tagged me as he knows my little obsession with calc groups. And indeed Calc groups can be the answer, but not in the way that I first imagined.
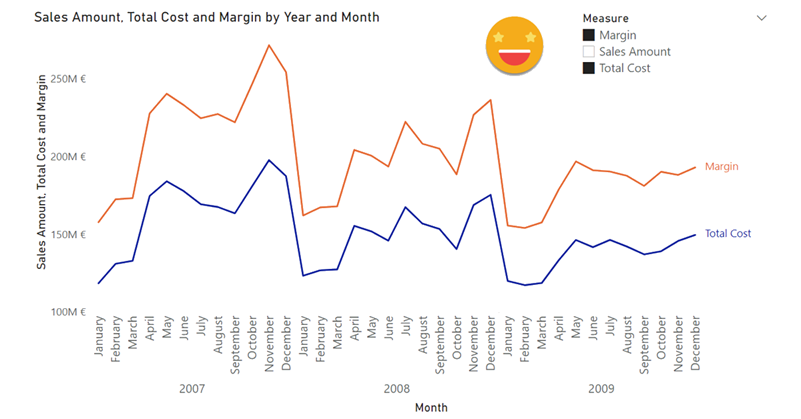
Hello, hello. After another round of presentations that dried my spare time to blog, just today a new use case came to me through a question in the whatsapp group of the Power BI User Group Barcelona. The goal was to be able to select the measures that should be displayed simultaneously on the same chart. The key here is the plural thing. Otherwise just use the famous script to create a dynamic measure calc group from Johnny Winter and off you go. But here the need is to select the measures from a simple slicer. I want to se measure A, B and D but not C.

Hello there, today I don’t have any new fancy use case for calculation groups or anything else, but rather a repository of links to the best of the best c# scripts… to create calculation groups. The main use of this post is to point people this way when I do a presentation on calculation groups, for example. Since they are «one-click» means you can just store it as Macro/Quick Action and even put it in a custom toolbar if you are using Tabular Editor 3 (which you should!). I’ll just start with two, but I plan adding more over time.

Once again I’ll recreate here a use case I found at work because I think it’s cool and with some gotcha’s that can be fixed.
The use case itself is broad enough. We are measuring the duration of an event (working hours, machine runs, etc) and we want to visualize it. Since we want to compare things, we need to graph a number, however, as humans, we might like to see 4h 30min instead of 270 min. Searching around in google you will find several approaches for transforming a number of minutes or seconds into higher units of time. And that’s a great starting point. For example here’s a great post by Reza Rad. Here we’ll just imagine we have minutes and we want hours and minutes.
I’ve been meaning to write this post for quite a few weeks if not months, and looks like today I may start finally to do it. The detonator has been that I had to do it at work, and Yuki asked about it on twitter. Too much of a coincidence to let it go.
Conditional formatting when calc groups are involved is a bit more challenging, but as usual with calc groups, once you grasp how they work you can do almost anything you want with it.
After a long break due to a truckload of presentations (for my standards) here I’m back again with the blog.
I have a pile of ideas, but always the latest idea takes priority as it is hot, it’s burning in my head.
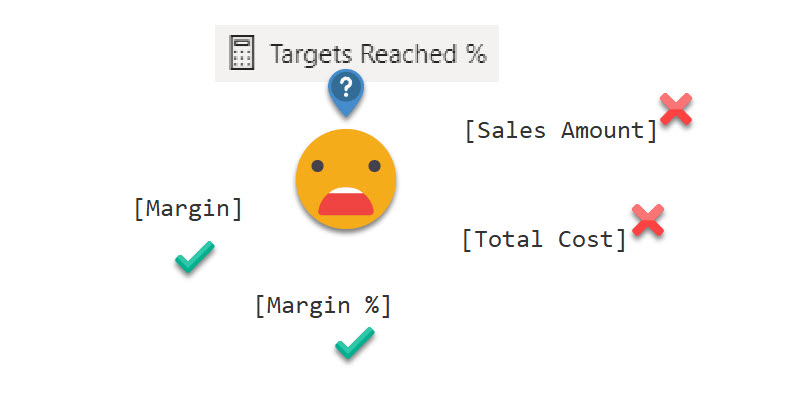
A guy from the Barcelona Power BI User Group asked me if calc groups could help him in a measure he was running. It’s like a measure of measures. There are several measures that represent different organizational KPIs, and they have a disconnected table in which there’s a target for each measure. He wants to know the percentage of targets that were met.
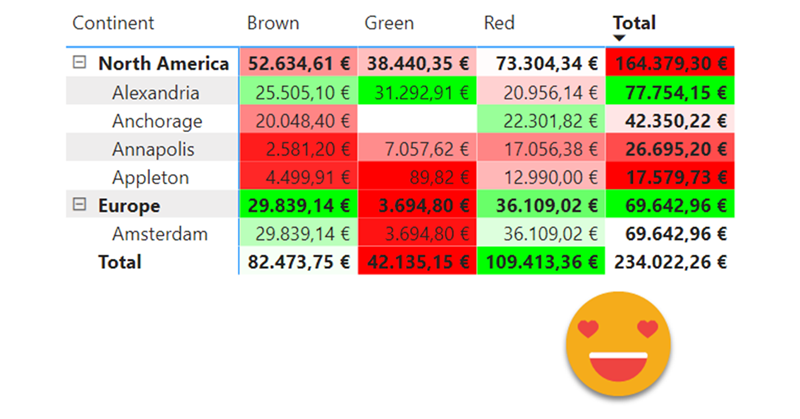
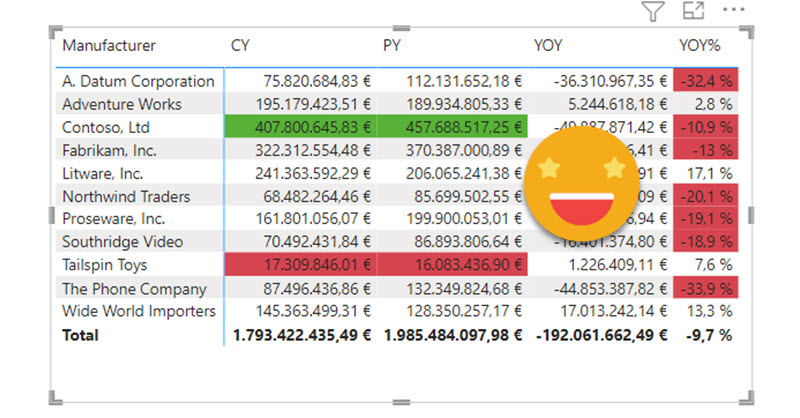
It’s a loooong title (well, it was «Conditional Formatting with divergent color gradient for values and totals»), but it’s exactly what I wanted to achieve when I discovered the limitations of the conditional formatting options in the GUI of Power BI Desktop. The key words are «dynamic» in one hand and «values and totals in the other» I know, some of you may think I’ll be doing some copy-cat article of the crazy video from Bas in which he shows how to use the undocumented (that I know of) function hsla(). A function that you need to leave as text?!? Crazy, just crazy. But no, I take a complete different approach and I think it’s worth the effort! Of course you can take ideas from both me and Bas and come up with your own unique approach for dynamic conditional formatting.
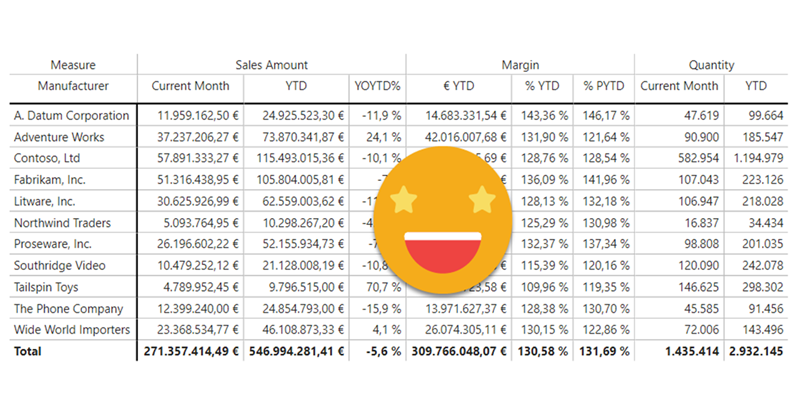
If you have worked with Matrix visual you probably have faced the problem: Your end user would like to group all the measures that are thrown in into neat little groups, putting all de Quantity- related measures in one group, all the value measures in another, for example. What I’ve seen so far is that people just struggle with the fact that this is not possible in the Matrix visual, and add text boxes on top, as if the header was indeed a two-row header. But it’s not. And if you have a large matrix that requires horizontal scroll, you’ll know what I am talking about. Can we do any better? Yes. Are calculation groups involved? You bet. Difficult DAX? Not at all!