Tag: Calculation Groups

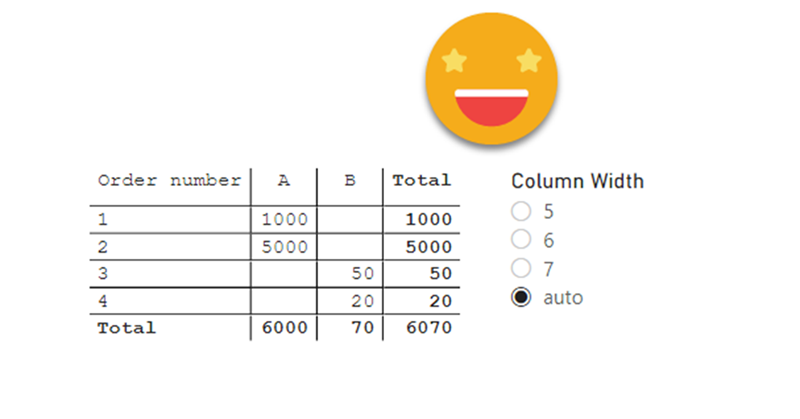
Ok, I have maybe gone a bit overboard with the title, but I think it has some advantages over other hacks out there to establish the column widths of matrix, so here I am to explain how I came up with it and how to use it.

The first hack I saw was from Ben Ferris (aka The Power BI Guy) which added a dummy measure with a number of 0 to make the width (having automatic width enabled) and then it would disable automatic widths and remove the measure. Nice. But of course, if new columns appear you’ll  need to set the thing again. Something similar happens with the approach of Bas, who skips the dummy measure thing and instead just plays with the format string to show the evenly wide number. His approach is cooler because you skip the measure thing, but you have the same weak points.

However, Bas’s video got me thinking on the topic and the role of format strings…

Continue Reading..

This may seem trivial, but it did not pop up in my head at first, so might be useful to somebody else.

In sales reports, there are lots of numbers. And if it’s a large company these numbers may be very large. So depending on the visual, the full number may be a bit too much, and having just thousands or millions is more than enough.

Continue Reading..

In this post I’ll explain how to break the tyranny of the «all filters» that are passed to the tooltip in particular the filters set by a calculation group which are even nastier to get rid of than regular filters.

It wasn’t intended this way, but this post is sort of a sequel (and not SQL) of my post on dynamic labels for time calculation series, which itself builds on the post introducing the time intelligence calculation group script. If you have not read them you can also watch the video you’ll find on the end of each post — although from the sound quality maybe it’s less painful to read the blog!

Anyway, if you are here probably you know something about calculation groups, and that’s good, because there’s plenty of them coming.

Continue Reading..

Sometimes we face models which can’t be built because we fall into the circular relationship (which Power BI protects us against) or ambiguity (which sits there silently making all our results meaningless). I faced one of this situations the other day at work and found a workaround with –you guessed it– a calculation group.

Continue Reading..

Ok, by now you probably know I’m a liiiiitle too much into calculation groups. Once you try calculation groups there’s no going back. Particularly if you do time intelligence analysis (that is comparing values with the previous year, but many other things as well). The reason is that normally you would create a new measure for each pair of calculation – measure, (e.g. Sales Amout PY, Sales Amount YTD,  Total Cost PY, Total Cost YTD … ). With calculation groups you just create the box that shifts a measure into producing the time calculation that you want.

Continue Reading..

Calculated tables are not used often, because after all, it only combines data that you already have, right? Well, I didn’t use them often, until recently.

I was shown an excel chart displaying market share among top contenders, but including CY vs PY, then CYTD vs PYTD, then MAT vs MAT-1, and then the last 12 months as individual points. «This is what we would like to have»
Continue Reading..


Contacto

Contacta con nosotros y descubre el poder de la información.

Nombre
Email
Consulta

Ok! Mensaje enviado.
Error! Verifica los campos.
© Copyright 2022 - Esbrina