Hello again,
after some inactivity the blog is flourishing again. It’s not really something I control. When there’s something I want to write in the blog, I suddenly imagine all the bloggers out there about to write the exact same blog post elsewhere, so I just need to do it, and do it fast. This is something I’ve been doing for real, but really applies in general so I think many can benefit from it. I’ve been asked to take *the* report and make it bilingual. But bilingual for real, so this includes everything: Titles, legends, data, everything. This is a topic that has been addressed a number of times, and yes, there are demos out there. However, the use cases presented in general are either very simple or they start with a project that from the start was known that it had to be bilingual. The reality is, though, rather more complex. I’ll try to write as I progress through this project once I have figured each one of the steps. Let’s do it.
Metadata translation is not really going to help you
When we talk about about translating a model most people say «Oh yes, I’ve seen that it’s right there in Tabular Editor. I think there’s even script out there that does it for you». And it’s true. Tabular Models have a feature that depending on the culture of the user connecting to the model, field names can be displayed in that language if it has been configured correctly. So far so good. HOWEVER, real measure and column names may be nowhere to be seen in an actual report. And why is that? Well, because people love to use custom display names! In a model, you can’t have two measures with the same name, but it could well be that in different charts there’s enough context to understand what is being shown, so actually the same name (say, «cases», «incidents» …) is used. When a custom display name has been used in a visual, no matter how many translations have you configured for that field, they are not going to show up, no matter what. Oh, and while we are on the topic, many fields will contain textual data that will need translation. As Marc Lelijveld explains in his wonderful blog post on multilingal reports, you will need a new field with the translated data. So if a column contains data in say Catalan, do you really need that field name to be translated in English? It might be nice if people are allowed to do self service reporting on the model, but for making a report bilingual, this is the least of our priorities right now.
Field Parameter All The Things! Or else!
Luckily for all of us, Power BI brought us the field parameters! Field parameters allow us to swap measures and fields used in visuals. Mostly they are used together with slicers so that people can customize the KPI or the dimensions by which is being sliced in a visual. However field parameters are very versatile. For starters, they allow you to add extra columns, with any concept you may want to add, but you can even create relationships between them and regular tables or even between field parameters! And yes, they even come with a column that works as a custom field name. So as long as we are using field parameters we can reuse the same measure and us different display name for it. But we are still far from building our field parameters. We first need the to get all those titles, text boxes and display names into a table so we can use a translation service.
Well, I know, there are places where you can’t use field parameters, such as titles. For these, will need to think in measures. Maybe we can just load a table and read from there? We’ll see. In some cases we might not have any alternative but to create a measure for that specific purpose and name it exactly as the text we want to display, so we can indeed use the model metadata translations. That’s the case of the legend title for the bar chart. At least as of today, July 28th 2024, you can’t make the name dynamic nor use a field parameter there. As you see Translating a report looks like straight forward thing, but the closer you get, the messier it is.
Hey what about Rui Romano’s notebook?
Yes, I’ve seen it and is indeed very interesting. As a demo it’s really cool (5 min to wow they say). However there are a couple things that prevent me going with the option. First and foremost, do we want a copy of the report in a different language? I can imagine that once you need to change the «master» report you will have to rerun the script, and thus the new reports will get new ids. And then of course you will need to rebuild your app. That’s quite a lot of clicky clicky as I don’t think you can build your apps programmatically yet. Also, I can even see people claiming that report in a different language shows different numbers just because they forgot some filter stuck in in one of them. And last but not least, let’s not forget that the demo is just replacing the titles. The reality is more tricky. Even if you could manage to translate the display names, well, not all fields have a defined display name, because maybe for that one case the original name is fine. However the field is in the language, so you need to translate that. How are you going to do it with this approach? Well, you could make sure that all fields and measures have display names, but that’s a pain. And wait a minute, what happens if you don’t like the translation you are getting? Bad luck. If you are talking about geography, «State» means one thing, but if you are talking about orders, «state» means something very different and other languages have different words for it. You need to have a way of modifying translations you don’t like. Oh, and let’s not forget that the demo does not, and will not, translate the actual data. So let’s stop dreaming and get back to work.
The Report
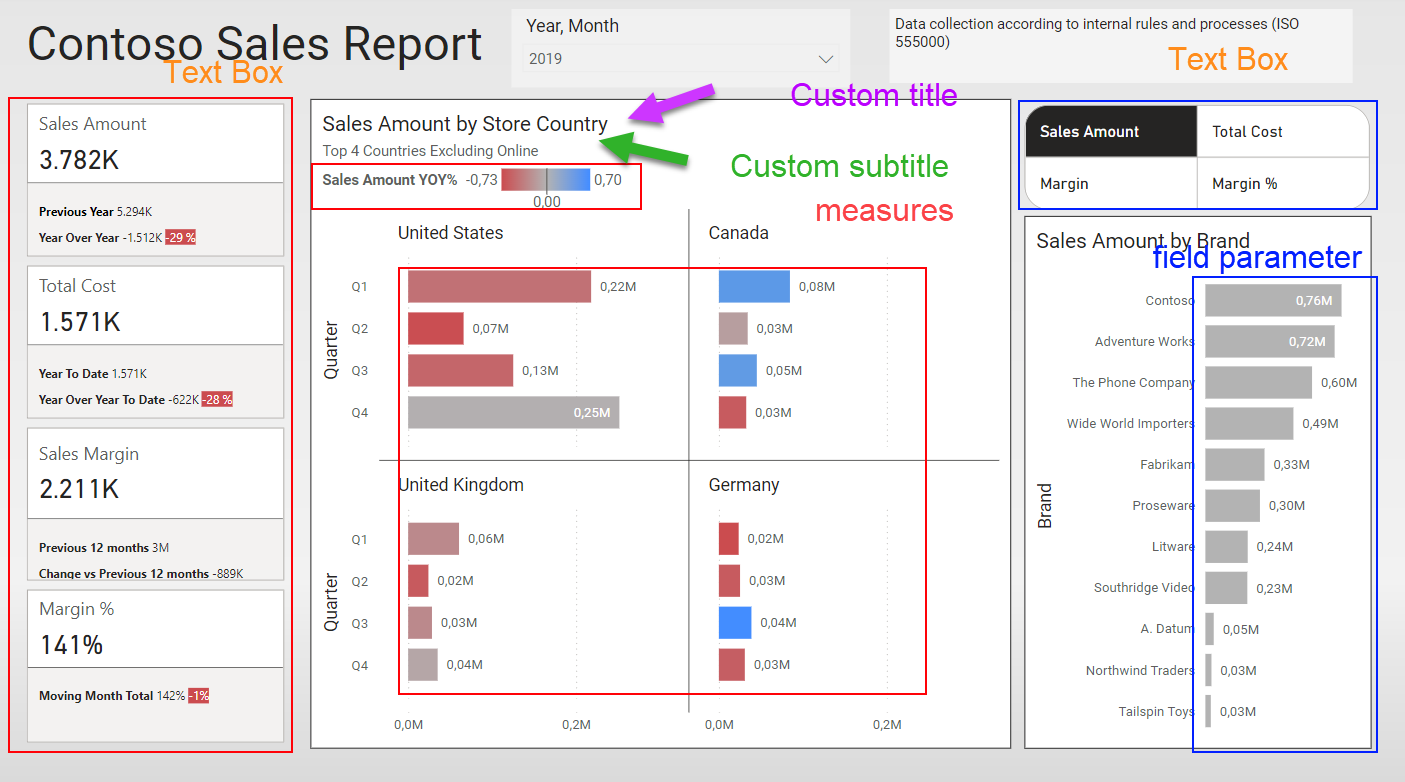
Let’s have a look at the report and the model.

As you can see it has a fair amount of complexity. Reference labels have a custom name, as well as one of the 4 main cards. It also contains a field parameter, that represents a whole different challenge.
Let’s start with the low-hanging fruit
When the request to translate a report comes, chances are that the model is long due to a complete refactor as it is one of the first that was developed and well, at the time nobody had any clue on how to build a proper model. After that the report somehow returns the right values so there has never been time to refactor it. However, translating the data is no joke, and people finally understand that there’s some heavy duty maintenance that needs to take place before it can be made bilingual. However, the request may come from somebody up above, so you can’t just say, «Yes, you’ll have the report in 4 months». You need to give then *something*. Well , that something might be the titles for starters, and then maybe also display names of measures calculating numbers and textboxes. No need to touch the model for these, and is work that will not be lost once the refactor has been done.
But how can we extract all these? Copy-paste is not fun. Well, luckily for us, there’s now something called PBIR! For some reason my last two articles also revolved about PBIR so it’s now three in a row. With PBIR we get the definition of the report in small-ish reasonable json files. So *anything* related to the setup of your report is there. What measures and fields are being used? check. What’s the title of the visual? check. What’s the text in that textbox? check. You just need some patience and a few power query tricks. Of course you can go with python if that’s your cup of tea, but I’m not that good yet in python, I just love how you can navigate jsons with power query, and I think it will be easier to transfer this project one day. «But about all those CUs Bernat?? » Hey, relax, you just need to run this once if you don’t change display names or titles or textboxes.
Infrastructure
As I was mentioning we’ll want to store data in a way that we can manually modify automatic translations so that the report makes sense. There might be a zillion different alternatives, but here’s what I went with: Fabric. I wanted to build it in Fabric as we had already one capacity, it’s what I know, and it should be fit for what we need to do. So we’ll bring first the data into a lakehouse (raw data but also the titles, display names and so on) and from there we’ll create the translations in a data warehouse just because updating records there is more intuitive to the people working in the organization. Finally we’ll might go to yet another warehouse or lakehouse from where data with translations will be visualized. Transformations will be wither Dataflow Gen 2, copy activity in pipelines or stored procedures. All orchestrated with a pipeline of course.
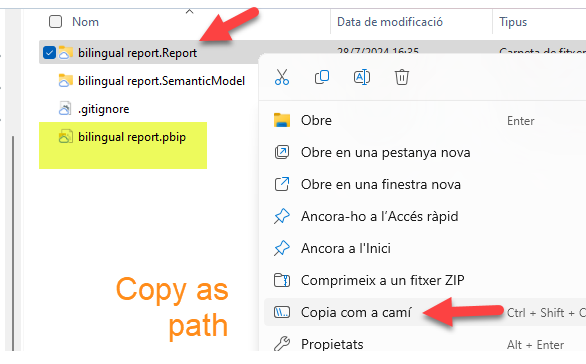
To extract the display names and the rest from the PBIR format, we’ll same the structure in a sharepoint folder. Since we’ll have to read many files spread across many folders I recommend to stick with the SharePoint.Files rather than SharePoint.Contents.
To make this exercise as accessible as possible though, we’ll first develop the extraction in a separate Power BI file and then we’ll move the Power Query code into a Dataflow Gen2 and hope for the best. As we’ll see some of the code may include DAX queries to the model, and in my first tries at least it tends to detect this a dynamic data source, which is not.
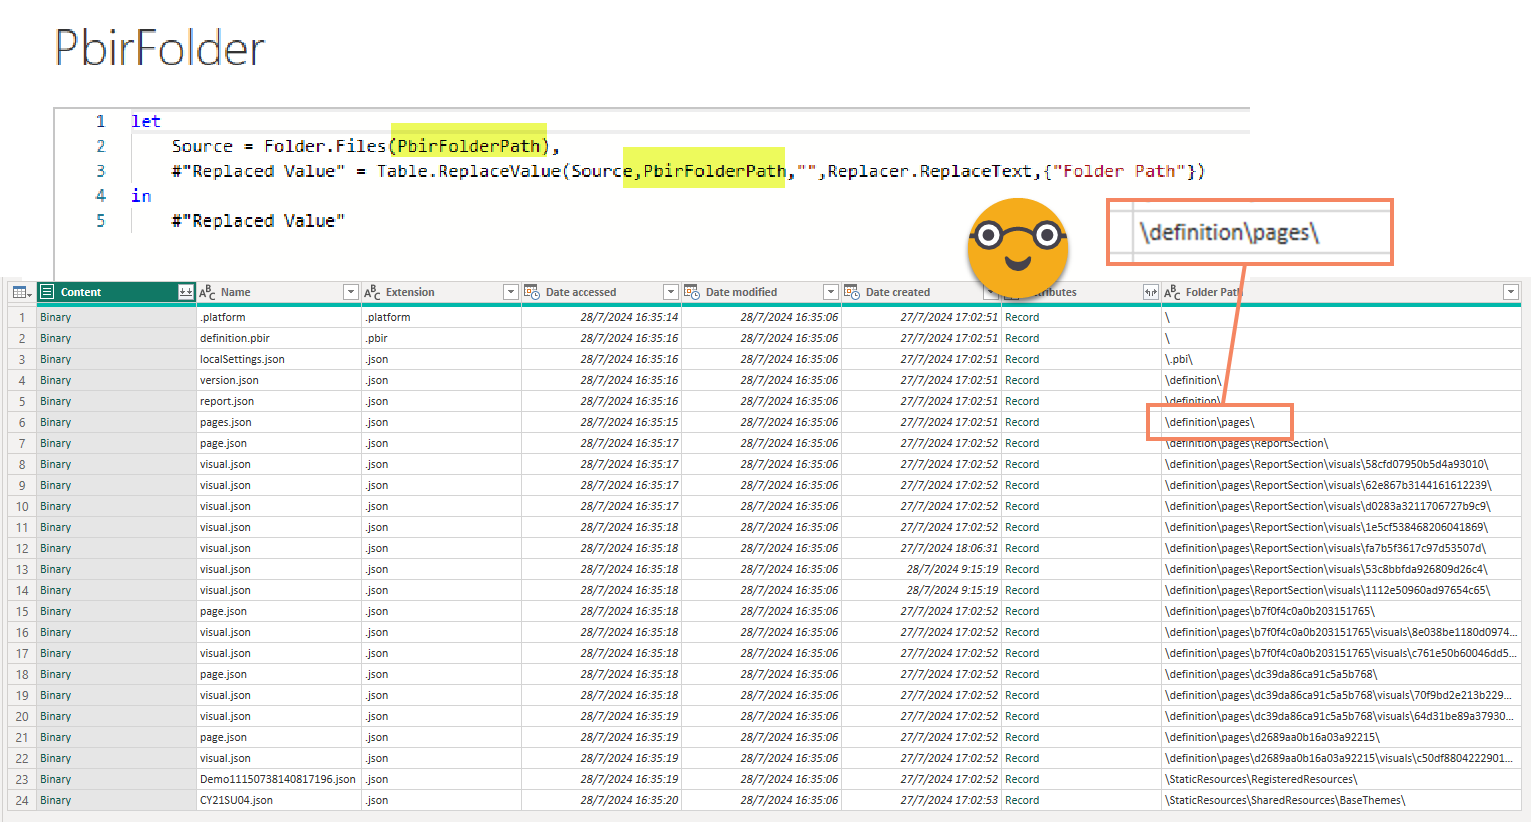
1. The relevant list of files


2. pages.json and all the page.json files
The pages.json file will provide you (only) the ids with the order. The «activePage» is not relevant for us so we can discard it. The code looks like this:
[code language=»powerquery»]let
Source = PbirFolder,
#"Filtered Rows" = Table.SelectRows(Source, each ([Name] = "pages.json")),
#"Pages.json file" = #"Filtered Rows"{[#"Folder Path"="\definition\pages\",Name="pages.json"]}[Content],
#"Imported JSON" = Json.Document(#"Pages.json file",1252),
pageOrder = #"Imported JSON"[pageOrder],
#"Converted to Table" = Table.FromList(pageOrder, Splitter.SplitByNothing(), null, null, ExtraValues.Error),
#"Added Index" = Table.AddIndexColumn(#"Converted to Table", "pageIndex", 1, 1, Int64.Type),
#"Changed Type" = Table.TransformColumnTypes(#"Added Index",{{"Column1", type text}}),
#"Renamed Columns" = Table.RenameColumns(#"Changed Type",{{"Column1", "pageId"}})
in
#"Renamed Columns"[/code]
Processing all the page.json files to extract the page names. After all you may need to translate them too! But no dynamic content is allowed there, you might need to build something creative. We’ll eventually get there.
To do it, just filter all the files called page.json and combine:

Each of the files is rather simple, unless you have page level filters and stuff like that. In any case we are only interested in the «name» and «displayName» which we’ll rename to «pageId» and the «pageDisplayName»

In big reports is very important to always have the page index and the page display name in all the tables that we’ll create to know what we are dealing with.

So far the json files are very simple. Things are about to change.
3. Getting the list of Visuals
The good news is that in PBIR each visual is a separate file, and they all follow the same schema. The bad news is that is a rather complex schema. But a schema is a schema so we can do stuff.
For starters, we’ll filter all the files that are called «visual.json». Next, we’ll extract the pageId from the Folder path. This will allow us to merge with our previous query and help us understand the metadata we see for each visuals and check at the right page on the report.

When go to the query to transform each file, the top structure is rather simple. We’ll get rid of the schema, rename the «name» to «visualId» and keep «position» and «visual» structures. Almost everything is under «visual». We’ll expand these objects in the main query.

the next level of position and visual are not huge so we can expand them in the main table.
At this point you realize that this starts to have a tremendous potential:

4. Let’s get the titles and subtitles!
It’s important to realize that these Jsons can be rather large. So the best is to open the PBIR folder as a project in VS Code so you can easily navigate between the files and and see where you can find whatever you want. If you start opening stuff to see what’s there, chances are you’ll make a mess. So creating relationships of the previous query we’ll focus on how to get the titles and subtitles. These are found inside the «visualContainerObject» so I’ll get rid of almost anything else to keep control of what I do.
However, once we expand the «visualContainerObjects» we see it’s a record, so the Title will be a column, subtitle will be another. Ideally I would want one underneath the other. This took me some trial and error, but finally I found a way to keep the name of each object, and the object itself. Basically, we’ll create a custom column that looks like this:
[code language=»powerquery»]= Table.AddColumn(
#"Removed Other Columns",
"Custom",
each Table.FromColumns(
{
Record.FieldNames([visualContainerObjects]),
Record.ToList([visualContainerObjects])
},
{"containerObjectName","containerObject"}
)
)[/code]
As you see we convert the record into a table, where the first column are the field names and the second column are the contents of each element of the record. Of course each of the objects may have a different structure, so you need to use this with caution, but let’s remember that we want to extract the contents of the title and subtitle. And by looking at the JSON file I saw that they follow the same structure. So I can filter by them and expand again, and again, and again and again. And eventually with a couple renames you can reach something like this:

5. What about the textboxes?
Textboxes are another low hanging fruit. Extracting the text is quite straightforward (well or downard in the json levels) but trickier to make bilingual. Unless I find a better approach I’ll use KPI cards with a measure instead of the textbox, but we’ll leave that bit for a future blog post. Let’s go back to the extraction. We create another reference to the Visuals query and now we’ll pick the pageId, visualId, visualType and objects. In this last one is where we’ll find the textbox contents, if we dig deep enough:

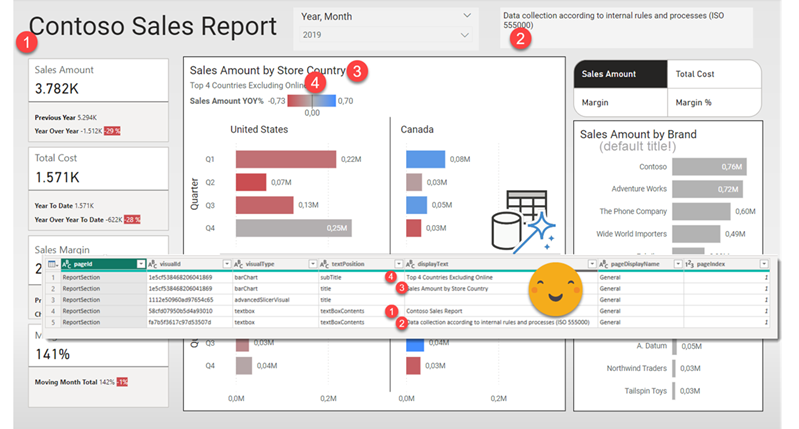
Why do I want this custom column you say? Well, I figured out it would be nice to combine this info with the titles one. and there I have a concept which is title or subtitle, and you can see I called that «textPosition» in the previous query. So by adding this column we can append both queries and it looks nice. Once we are at it, why not merge it with the Pages Query?

Let’s do it one step at a time
Well, this is a massive project. Each step is interesting (for me at least!), so I’ll do it in small-ish bits. On the next installment, we’ll dive into getting the fields (columns and measures) used in each visual and how to translate the display names of the measures. We’ll leave the columns for later since we’ll need to translate the data and so on. When we start making the report dynamic, though we’ll have a problem. The hard-coded titles will no longer be there so how do we build a complete list of all the titles translated? We’ll we’ll get there too, don’t worry!
For now, if you want to test
- example report as a zipped pbip folder (expand before using!)
- extractor pbix file to check without any setup
- extractor pbit file to try the whole experience, or with your own reports
This could be a very long series of posts, so bear with me!
Ps: As I was building the cover image for this blog post I realized that the title from the chart on the right did not get picked up because it’s just the default title, and as such it does not show up in the visual.json file! well, before launching such an endeavor we’ll need proper titles since the default option will not be there anymore! So many little things.
Follow the conversation on Twitter and LinkedIn
