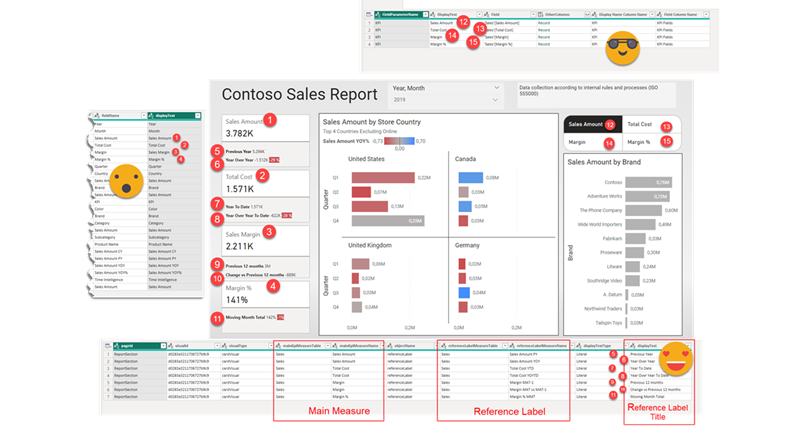
Hello again! This article is part of a series, so if you just discover this, I strongly recommend you start from the beginning. Let’s continue digging through the visual.json files. Today we’ll extract the fields used in visuals and we’ll figure out a way to extract the the first column of field parameters, where we set up the names we want to use. Yes, we’ll need to translate these as well.
Give me the fields!
Let’s see if we can extract the fields. After some analysis of the visual.json files we see the info is in the query object. I strongly recommend VS code to move around these files, very smooth.
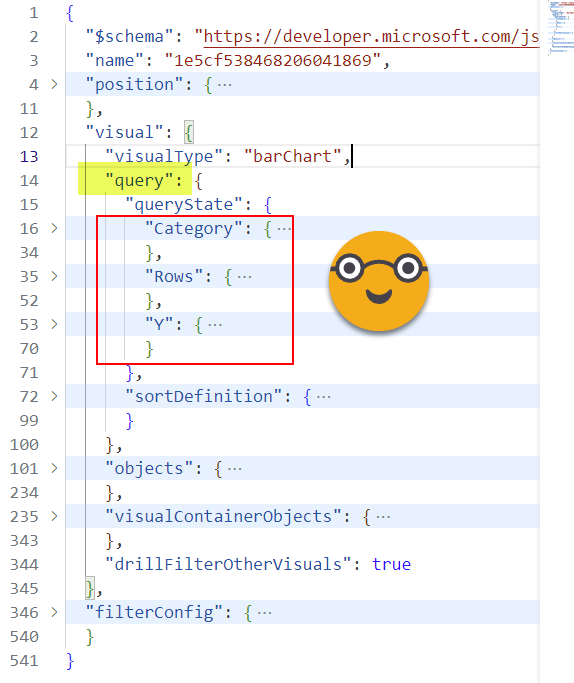
However, we see that these are different objects but inside they contain the same structure. Each visual will have different «queryState» members, so instead of expanding them as columns I would rather expand them as rows. But how can we do that?
Well starting from our «visuals» query, we’ll keep just the ids, and the «query» field. Then expand into only «queryState». Then we remove nulls as not all objects have queryState (think of images or textboxes that do not have fields in their definition). This step is a bit trickier than it looks because we might not see the traditional filter button that allows us to remove values. The right click on a null value will not save the day either.
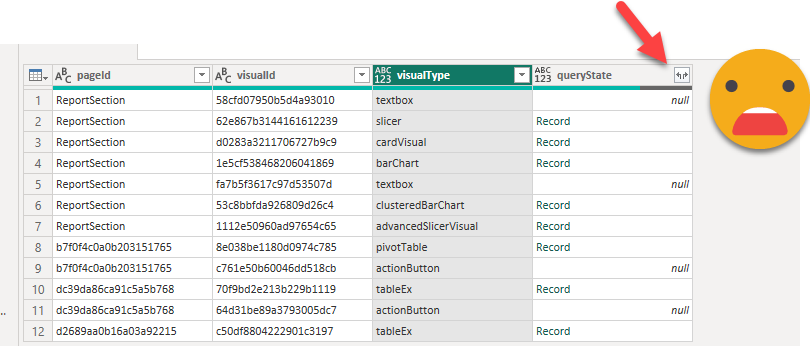
But fear not. Just select any other column and remove any value, and just rewrite the filter expression to [queryState] <> null. Easy peasy.
And then, let’s repeat the trick we did also in the previous article, create a custom column with this formula:
 Table.FromColumns(
    {
        Record.FieldNames([queryState]),
        Record.ToList([queryState])
    },
    {"queryStateType","queryState"}
)
This will generate a table and in each row we’ll have the different queryState types («Category», «Rows», «Y») which translate into the different sections in which we can drag and drop fields in Power BI Desktop.
When we expand the queryState column we’ll find something called «projections» which is a list. Expand it and you’ll see records again. But here again we’ll might see some nulls, for instance if we did not use any field for a legend for example. With the same trick as before we filter these nulls out. Now we expand but keep only field and displayName*. We already got half of what we wanted, the display name. The field object contain the other half.
(*Actually we’ll keep also queryRef and the reason comes from the last part of this blog post…)
But again a field could be either a measure or a column, but inside they have the same structure, so let’s transpose the record again this with our trick
Table.FromColumns(
    {
        Record.FieldNames([field]),
        Record.ToList([field])
    },
    {"fieldType","field"}
)
I swear I had never used that function before, but it’s so convenient to deal with these json files.
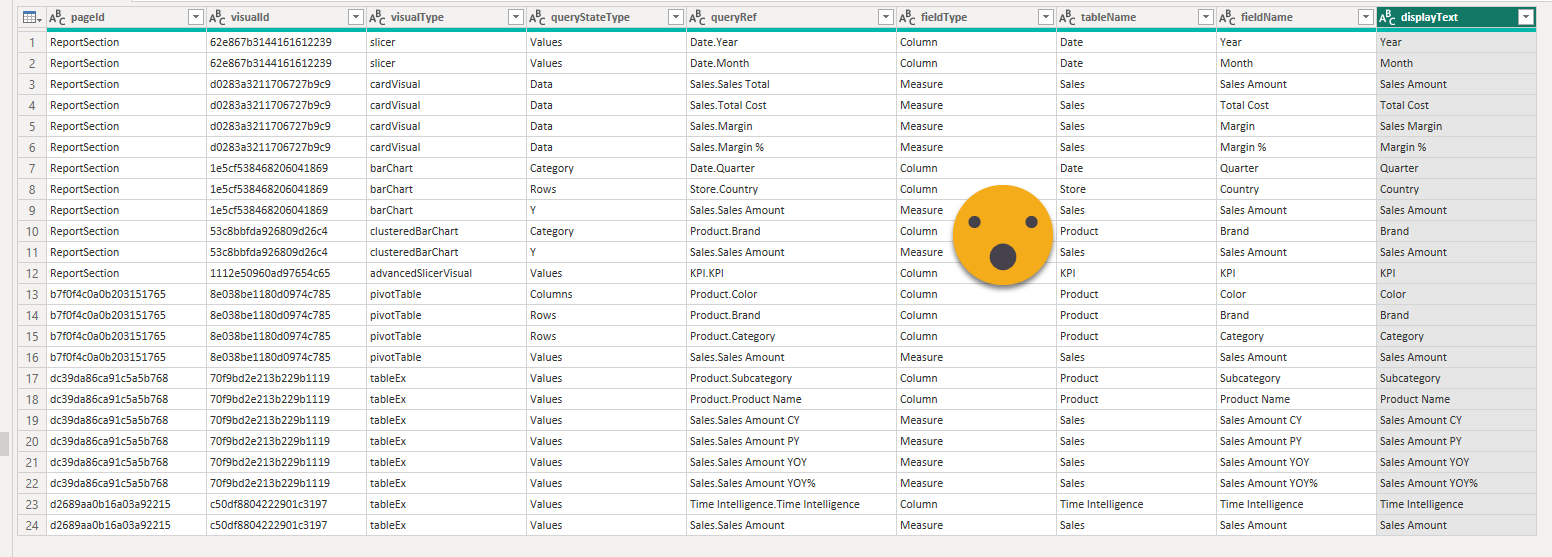
FieldType is either Measure or Column, and inside the field, we find «Expression» and «Property», where «Property» is already the name of the column or measure. Inside expression we find sourceRef and inside it Entity, which is indeed the table name of the column or measure.
However, as we have seen in other places, if we do not change something, that something does not show up in the visual.json. With this I mean that if we did not change the displayName, the displayName property will be null. We want to translate everything so we will need a field «displayText» that consolidates both columns:
[displayName] ?? [fieldName]
if fieldName is defined, pick it. Otherwise use fieldName. Of course you could argue that we could translate fieldName through the metadata translation functionality, but at this point I think it’s more flexible to handle everything with field parameters, so in practice we will handle all names as if they were custom names.
Well, the final result is not bad!
What about field parameters?
Most field parameters are either measures or columns, and now we’ll take care of the measure ones. Indeed is like a group of measures with their displayname already set up at the model level, which is cool, but at the same time it means we’ll need to find a new strategy to extract those. I haven’t completed the process so we might need modifications to this process, but for now let’s see how could we extract the displayname, measure, table for each row of the field parameter.
We could try to dive into TMDL format, but even though it’s easy for humans to read, now it’s not so easy to read with power query! oh well. We could also try to extract the table expressions with the scanner api if the model is published, but that seems a bit of an overkill.
Indeed we need to first get a list of all the field parameters, and then evaluate each of the tables. This will provide us all the columns of each of them, which includes the display name (normally the first column) the field (normally the second column, as well as the order (Third column) and any other columns that have been added for modeling needs. Believe it or not all this is possible with the DAX queries! Let’s see how this is done.
First let’s go to new query and select the Analysis Services connector. For server, we’ll copy it from the model view in power bi desktop of the instance containing the report we want to translate and store it in a parameter, since this will change every time we open the file.
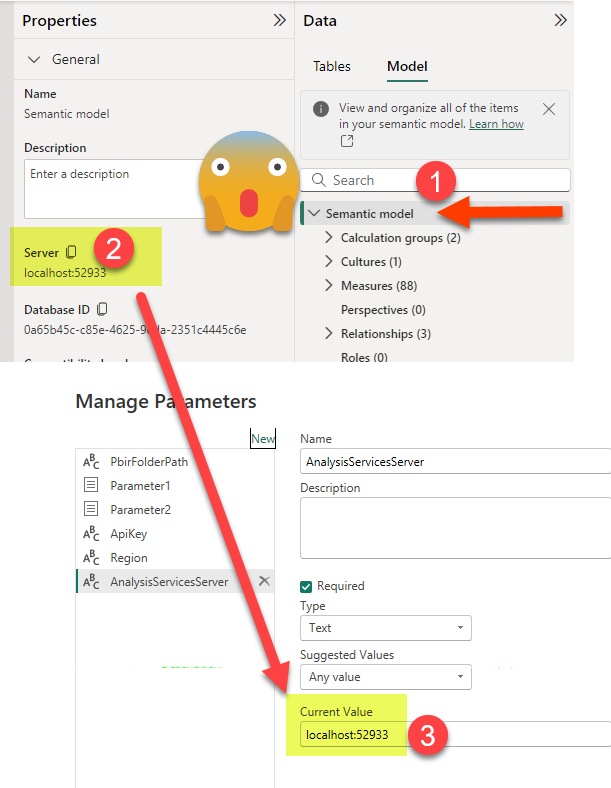
If we move all this into dataflows or Power BI in the service we’ll use the XMLA endpoint instead. If we connect locally we’ll only see a database, on the server we would see other semantic models of the workspace. Let’s click on the «Table» cell of the data column of the model we want and let’s stop here. Let’s call it «Model». Oh yes, when connecting locally say you want to use your current windows credentials. When connecting through the XMLA endpoint use your microsoft account.

Now let’s create a reference to this query and call it «FieldParametersTables». And then add a custom step which will evaluate a DAX query against that model. What query? Well, this is a bit tricky but a lot of fun.
EVALUATE
VAR _fpColumns =
    SELECTCOLUMNS (
        FILTER (
            INFO.EXTENDEDPROPERTIES (),
            VAR _value = [Value]
            VAR _valueNoLineBreaks =
                SUBSTITUTE ( _value, UNICHAR ( 10 ), "" )
            VAR _valueNoSpaces =
                SUBSTITUTE ( _valueNoLineBreaks, " ", "" )
            RETURN
                [Name] = "ParameterMetadata"
                    && _valueNoSpaces = "{""version"":3,""kind"":2}"
        ),
        "ObjectID", [ObjectID]
    )
VAR _allColumns =
    SELECTCOLUMNS ( INFO.COLUMNS (), "ObjectID", [ID], "TableID", [TableID] )
VAR _fpColumnTableId =
    NATURALINNERJOIN ( _fpColumns, _allColumns )
VAR _allTables =
    SELECTCOLUMNS ( INFO.TABLES (), "TableID", [ID], "Name", [Name] )
VAR _pfTables =
    SELECTCOLUMNS (
        NATURALINNERJOIN ( _fpColumnTableId, _allTables ),
        "Field Parameter Name", [Name]
    )
RETURN
    _pfTables
«What on earth?» you might be thinking, but fear not it will make sense in a few lines. You see field paramaters are not really a thing in the semantic model world. They are just tables with some specific properties that the report layer of Power BI treats in a special way. So there are no specific functions to list them and instead we kind of need to build them ourselves. What is always true though is that they need a column with an extended property with certain name («ParameterMetadata») and certain value ({«version»:3,»kind:2}) Don’t ask, is how it works. Luckily there’s an info function that returns all the objects with extended properties. Filtering by this will return us the columns of all field parameters (and hopefully nothing more!). As you may get from the code, we need to remove spaces and line breaks that may be there to ensure that the value is what we want no matter how it is formatted. Next we get a table with all the columns and we strategically rename the ID column to «ObjectID» which is the name that we get from the first query, and we add only the tableID. Doing a natural inner join between the two will reveal the tableId of the field parameter. But of course we want the name so we will join again with a selection of columns coming from the INFO.TABLES and we’ll keep just the one with the name.
The best way to do a native query is to store it as a separate (non-loading) query and then reuse that in the expression. To do so just create a blank query, and paste all the text directly in the formula bar without any equal sign. It will add all the special chars itself.
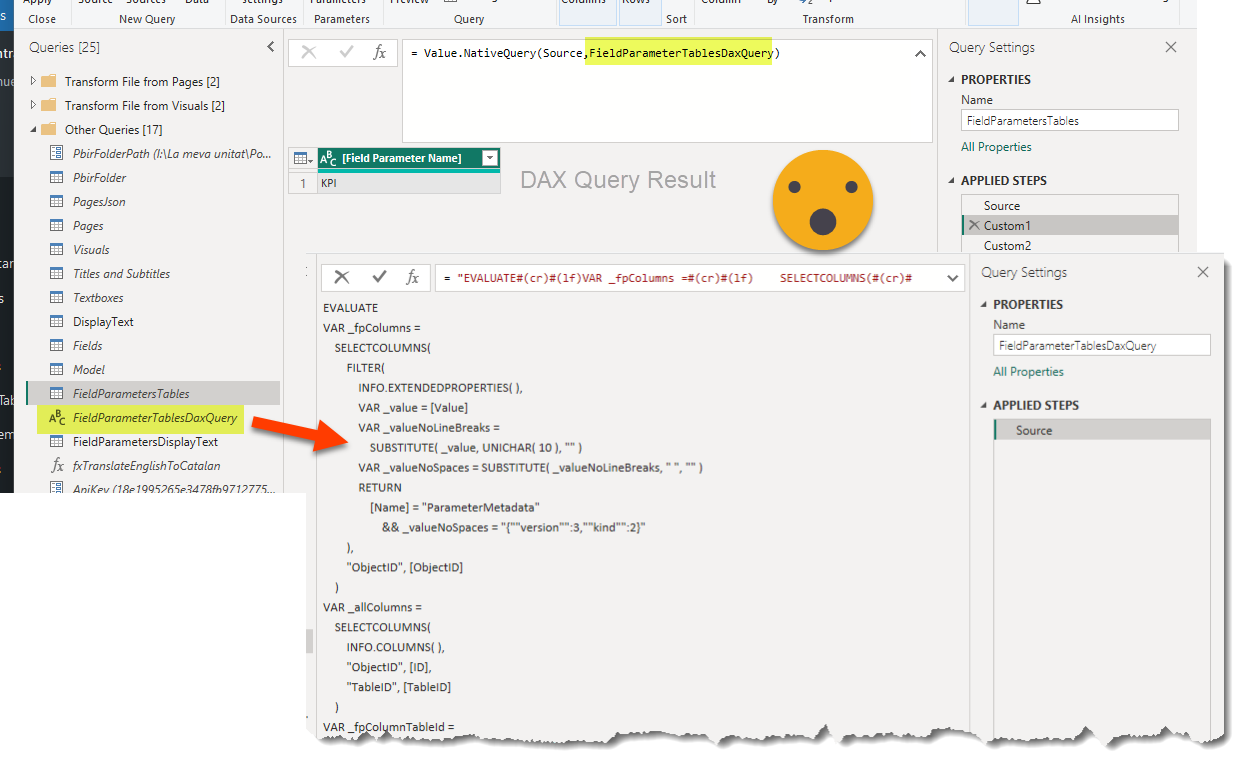
Now DAX queries have the bad habit of coming with all these ugly square brackets. you can clean that up with the Table.TransformColumnNames + Text.BetweenDelimiters,but you can also get fancy and remove all chars you don’t like, like this to remove also spaces:
= Table.TransformColumnNames(
    Custom1,
    each Text.Combine(
        List.Select(
            Text.ToList(_),
            each not List.Contains({"[","]"," "},_))))
Maybe this is not quite clear, let’s rewrite it using variables:
= Table.TransformColumnNames(
    Custom1,
    each let
        charList = Text.ToList(_),
        badCharList = {"[","]"," "},
        charListClean =
            List.Select(
                charList,
                 each not List.Contains(badCharList, _)),
        textClean = Text.Combine(charListClean)
     in
        textClean)
This being powerquery, the first _ is the colum name, the second one is the character of the column name. Well, enough of that. Let’s get back to the field parameters.
We just have the field parameter name so far. How can we evaluate it? With another DAX query of course!
Let’s create yet another reference from this query and call it «FieldParametersDisplayText». Now add a custom column and as formula just enter «Model» which is the name of the query we used when we first connected to Analysis Services. And let’s repeat the Value.NativeQuery trick. This time though the query is way more simple, just put single quotes around the table name, just in case.

However now we may have a problem. If we have more than one field parameter, each will have different field names, so that would expand in different columns of our table, and that would be a mess. My wish is to have the first column of the field parameter called «display name», the second column called «field» and then all the other columns combined into a record. Because who knows if they will have extra columns or not. I’ll just keep them because eventually we’ll have to rebuild the field parameter. But of course when we do we’ll also need the name of the first column and the name of the second column. How can we build that?? Oh yes, powerquery time!
= Table.AddColumn(#"Added Custom1", "FieldParameter", each
let
  c = [Custom],
  t1 = Table.FromColumns(
    {
      Table.Column(c,Table.ColumnNames(c){0}),
      Table.Column(c,Table.ColumnNames(c){1}),
      Table.ToRecords(
        Table.SelectColumns(
          c,
          List.Skip(
            Table.ColumnNames(c),
            2)))
    },
    {"DisplayName","Field","OtherColumns"}),
  cNames = Table.ColumnNames(c),
  cNamesClean = List.Transform(cNames, each Text.BetweenDelimiters(_,"[","]")),
  t2 = Table.AddColumn(
    t1,
    "FieldNames",
    each [
      Display Name Column Name = cNamesClean{0},
      Field Column Name =  cNamesClean{1}
    ])
in
  t2)
How did I learn to write like this? Well, fighting ! And reading! Master your data and The Definitive Guide To Power Query M are excellent books you should read. You see, using variables seems complex but actually makes things much easier. I create a table from columns meaning that I need to provide a list of lists. When we retrieve a column from a table we get a list, so I retrieve column 0 and column 1 (0-based lists of power query). Next I need all the other fields. And very important it needs to be a list, you can’t just pass a table. So what I did is get a table with all those fields and then convert this to a list of records. And then last but not least I retrieved the field names of the original table (not the one we are building now) and got the text between the square brackets. And from that list I retrieved the 0th and 1st elements and created a record with them. This is like adding two columns at once. From that point on is just a bit of house keeping of removing unneeded columns, setting types and changing some column names.

I know, in this case the displayText is exactly the same as the measure name. BUT IT COULD BE DIFFERENT. Better safe than sorry.
Hey and what about those reference labels??
I swear I was about to publish this post and was building the header image when I realized I had not extracted the reference labels of the multi card thing. I knew that would not be easy, but hey, everything is there so it took some effort but I managed in the end to get a table with the main measure, the refrence label measure and the hard coded label of the measure. I saw that this could be dynamic so yes, it can be done. It just depends on if you have enough willpower to get it or not. The trick about transposing the record? I lost track of how many times I’ve used it this time.
Let me explain this with some key findings:
– the main measures are inside «query», while all the other measures used for reference labels are inside «objects»
-«queryRef» was a property uninteresting for me so far, turns out is the link with the reference labels.
– you basically need to pay attention to «referenceLabel» and «referenceLabelTitle». The detail does not have any text go along with it. This also filters out any other visuals for me. I wonder if other visual objects have such properties. Maybe bar the new bar charts do. Haven’t tested.
-The referencce label title and the reference label get connected with GUID called «id».
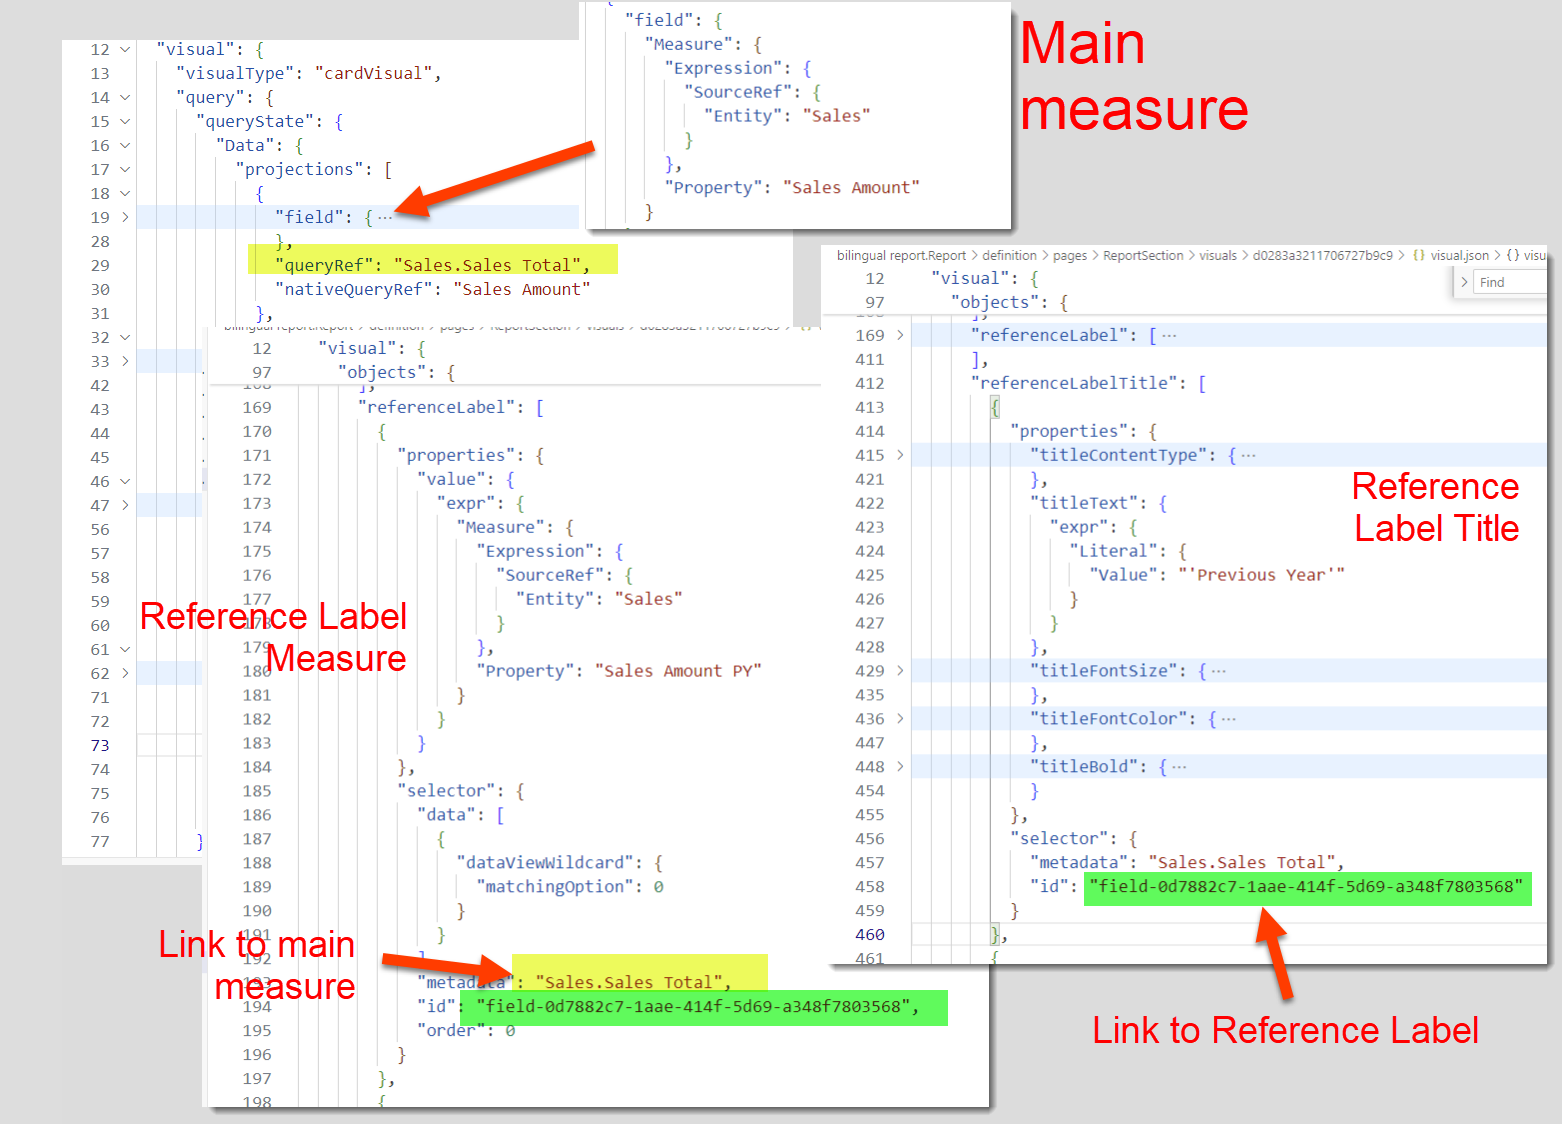
So what I did was to first unpack as much as I could from the objects structure and from there create two references, one in which I filtered by the reference labels and another one with the reference label titles. And then I joined them with the «id» field. (well and the page id and visual id just in case). Then I also joined that with a slightly modified version of the fields query that kept the queryRef info and used it to join both queries as well (along with page and visual id). The end result looks like this:

Stricktly speaking we will only need to translate the refrence label title, but I thought that if at some point we need to mass-produce the measures to make all those titles dynamic, we’ll probably need to know where they come from so that we can put some sensible measure name and display folder to them. We’ll get there some day, maybe in like 3-4 posts distance from now.
And well, let’s stop for now. For real. More coming soon.
